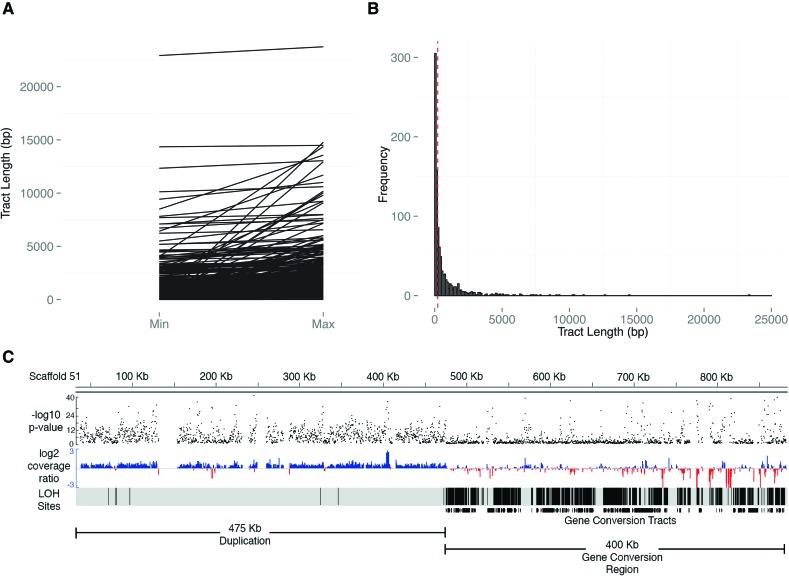
Figure 2.
(A) Parallel coordinate visualization of the minimum and maximum lengths for conversion tracts. The minimum (min) and maximum (max) possible lengths for each event are shown on the x-axis, with the tract length (bp) shown along the y-axis. (B) Frequency distribution of tract lengths. Visualization of the size distribution of the midpoint of the minimum and maximum tract lengths for all 879 conversion tracts in the ASEX experiment (see Supplemental Materials and Methods). Vertical bars group conversion-like tracts by size in 100-bp increments. The red vertical dashed line denotes the median tract length (221 bp). (C) Complex region of large-scale duplication directly flanking a concentrated region of gene-conversion region. Black dots (top track) represent −log10P for each consecutive sliding window on ∼900 kb of scaffold 51 in ASEX-2 and denote the probability the normalized depth of sequencing coverage deviates from 1:1 by chance between the MA subline where large-scale duplication occurred and the normalized average coverage of the other sublines (see Methods). On the middle track (red and blue), the normalized, log2 coverage ratio of the subline where the de novo CNV mutation versus a composite of the other three subline comparisons is plotted in 500-bp windows, with sliding 250-bp increments. The “LOH sites” tract represents a density plot of LOH positions (i.e., individual nucleotide positions of LOH), while the bottom track (gene conversion tracts) shows density of gene-conversion-like tracts within the region. The conversion region begins within 500 bp of the large-scale duplication. Note how the far 3′ end of the conversion region has intervening regions of deletion, starting ∼730 kb, indicating further mutational complexity.

