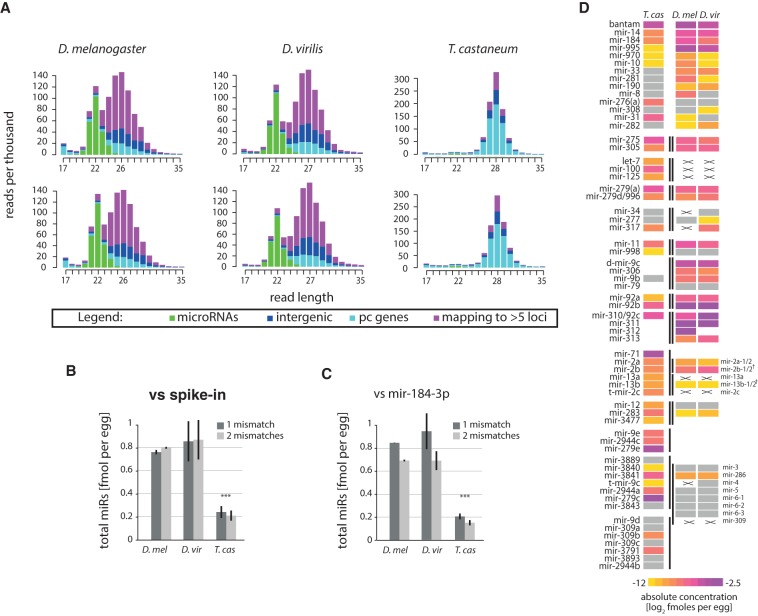
Figure 3.
Quantities and conservation of maternally deposited microRNAs. (A) Read size and count distributions of small RNA sequencing libraries from oocytes in the three species (two biological replicates per species). Reads are colored depending on their mapping position to microRNAs (green), protein-coding (pc) (cyan), intergenic regions (blue), or multiple (>5) sites in the genome (purple). (B) Absolute abundance of total microRNAs as determined by deep-sequencing read counts relative to spike-in. (C) Absolute abundance of total microRNAs as determined by deep-sequencing read counts relative to miR-184-3p. In B and C, quantification from deep-sequencing analysis was performed using one and two allowed mismatches between read and genome. (D) Heat map showing the estimated concentrations of conserved microRNAs or clusters of microRNAs between Drosophilids and T. castaneum. MicroRNAs below an arbitrary threshold of 0.0002 fmol/cell are shown in gray. Lines mark clustered microRNAs. Crosses mark conserved microRNAs that are not expressed, while blank spaces denote absence of a given homolog from the corresponding cluster in a given species. MicroRNAs are aligned by homology; note that the mir-3∼309 cluster of Drosophila has three homologs in Tribolium. (†) mir-2 cluster in Drosophila has split.

