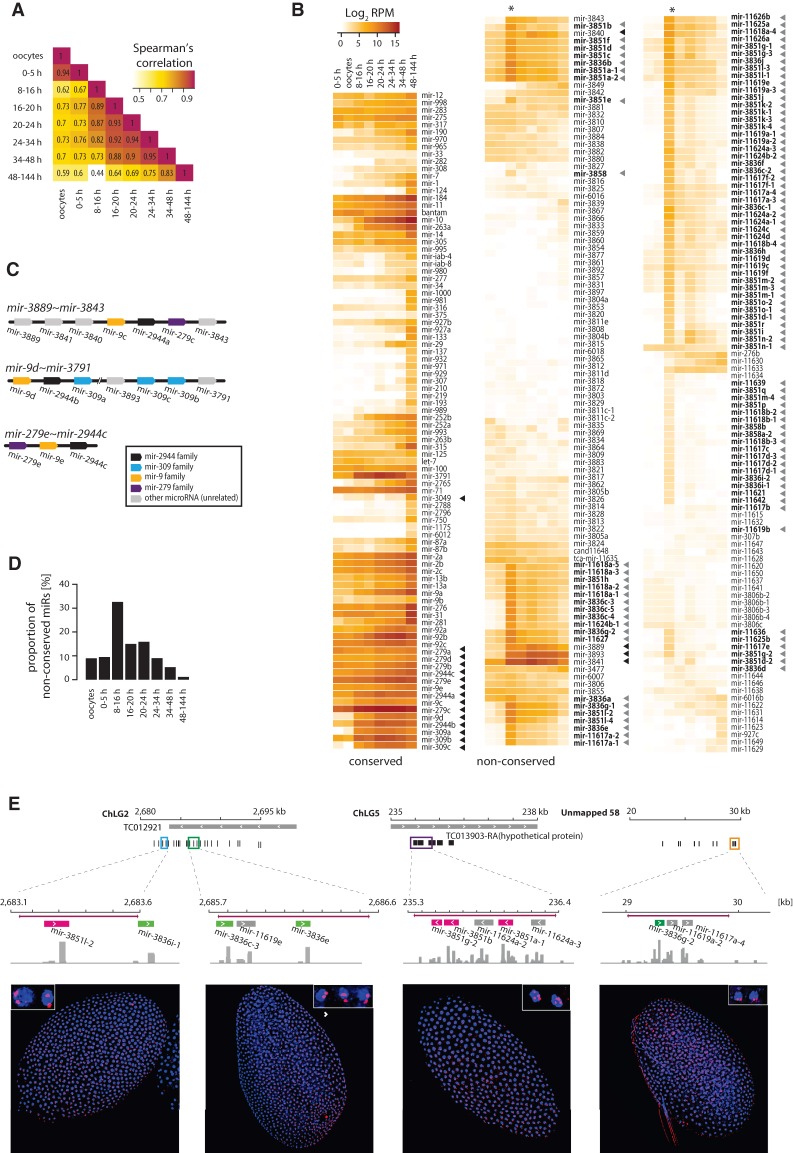
Figure 5.
Developmental expression of conserved and nonconserved microRNAs throughout T. castaneum development. (A) Heat maps representing Spearman's correlation values for all-versus-all comparisons of the microRNA expression levels in oocytes and embryonic intervals of 0–5, 8–16, 16–20, 20–24, 24–34, 34–48, and 48–144 h. (B) Heat maps showing the normalized expression levels (reads per million) of conserved and species-specific microRNAs in T. castaneum oocytes and developmental intervals. Gray arrowheads indicate microRNAs from the mir-3851 and mir-3836 families and other microRNAs clustered in the same loci, as in Figure 1. Black arrowheads mark members of the mir-279e∼2944c, mir-3889∼3843, and mir-9d∼3791 clusters. (C) Diagram of the genomic organization of the T. castaneum mir-279e∼2944c, mir-3889∼mir-3843, and mir-9d∼3791 clusters. MicroRNAs are color-coded based on sequence homology. (D) Relative proportion of Tribolium-specific microRNA reads at different developmental stages. (E) Spatial expression of Tribolium-specific microRNA clusters detected by in situ hybridization. Top diagrams indicate the genomic regions encoding Tribolium-specific microRNAs used for antisense DIG-labeled RNA probe design, with probe regions in colored boxes. MicroRNA genes are black or color-coded based on homology to mir-3851 (magenta) and mir-3836 (green). Histograms represent coverage tracks generated with IGV. (Bottom) Confocal images of T. castaneum blastoderm embryos showing nascent microRNA transcripts (red); blue represents DAPI nuclear staining.

