Figure 6.
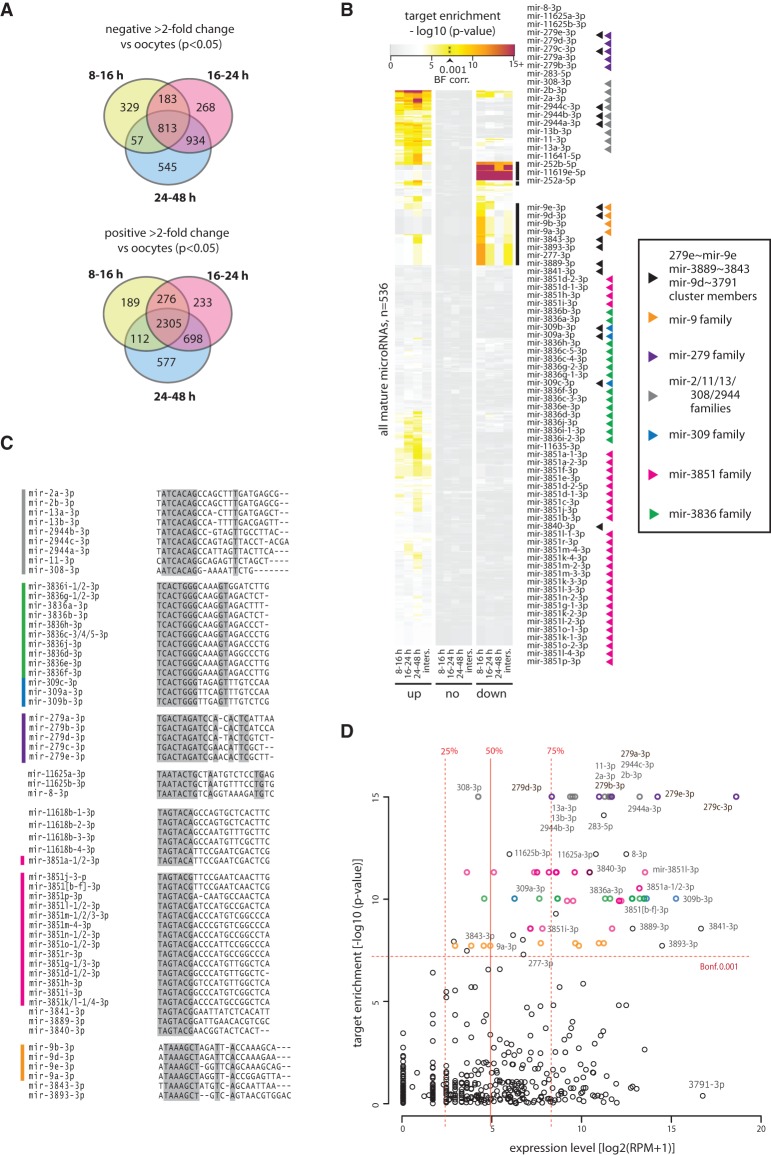
MicroRNA targeting of maternally deposited transcripts in T. castaneum oocytes and developing embryos. (A) Venn diagrams showing the number and overlap between greater than twofold up- and down-regulated transcripts (P < 0.05) between T. castaneum oocytes and the three embryonic time intervals (8–16, 16–24, and 24–48 h). (B) Hypergeometric P-value for mature microRNA targets enrichment predicted based on canonical site interactions among genes down-regulated (“down”), up-regulated (“up”), and not regulated (“none”) from oocytes to 8–16, 16–24, and 24–48 h embryos. “Inters” denotes the intersection of the three individual sets. The two groups of microRNAs with enrichment P-value < 0.001 (Bonferroni corrected) in the down-regulated transcripts are expanded and labeled (right). Arrowheads indicate microRNA family and clustering. The values underlying the heat map representation and full data are available as Supplemental Table 3. (C) Alignments of mature sequences of major seed families with highly enriched targets in the zygotically down-regulated gene set. Side bars indicate microRNA families color-coded as in B. Shading indicates 100% base identity at a given position. MicroRNAs with identical sequences are collapsed on a single line. (D) Relationship of microRNA expression and target enrichment in the down-regulated gene set in the 8–16 h embryo. Vertical lines show the median, upper, and lower quantile values, and horizontal line shows the 0.001 P-value after Bonferroni correction threshold. Points corresponding to the microRNAs outlined in B and C are color-coded accordingly. Selected microRNAs are labeled.

