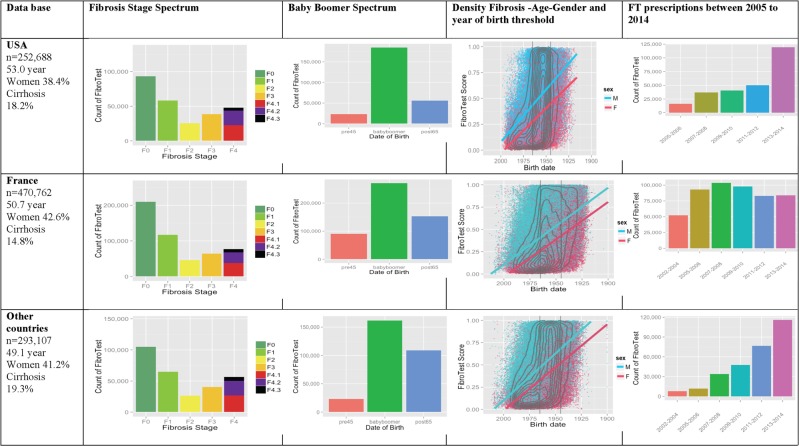
Figure 1.
Awareness of liver fibrosis according to the FibroTest in USA, France and in other countries. First column (main characteristics): number of subjects, median age, percentage of women and of subjects with cirrhosis. Second column (fibrosis stage spectrum): presumed METAVIR stage by the FibroTest—F0, no fibrosis; F1, minimal fibrosis; F2, few septa; F3, many septa; F4, cirrhosis. Cirrhosis F4.1 (red), compensated cirrhosis without risk of bleeding; F4.2 (violet), compensated cirrhosis with risk of bleeding; F4.3 (black), decompensated cirrhosis (cancer, bleeding, liver failure). Third column (baby boomer spectrum): number of subjects according to year of birth—before 1945 in orange, 1945–1965 in green, after 1965 in blue. Fourth column (fibrosis–age–gender): fibrosis density plots according to fibrosis presumed by FibroTest (y-axis) and year of birth (x-axis). All subjects are represented. The concentric black lines are density centiles, with the highest density being in the inner circle; subjects outside the outer line comprise <10% of the population. The two vertical black lines indicate the years of birth 1945 and 1965. The two crossing lines represented linear regression between FibroTest and date of birth, according to gender (men in blue and women in red). Fifth column (FibroTest (FT) prescription rate): number of subjects according to the test year between 2005–2006 (orange) and 2013–2014 (rose).

