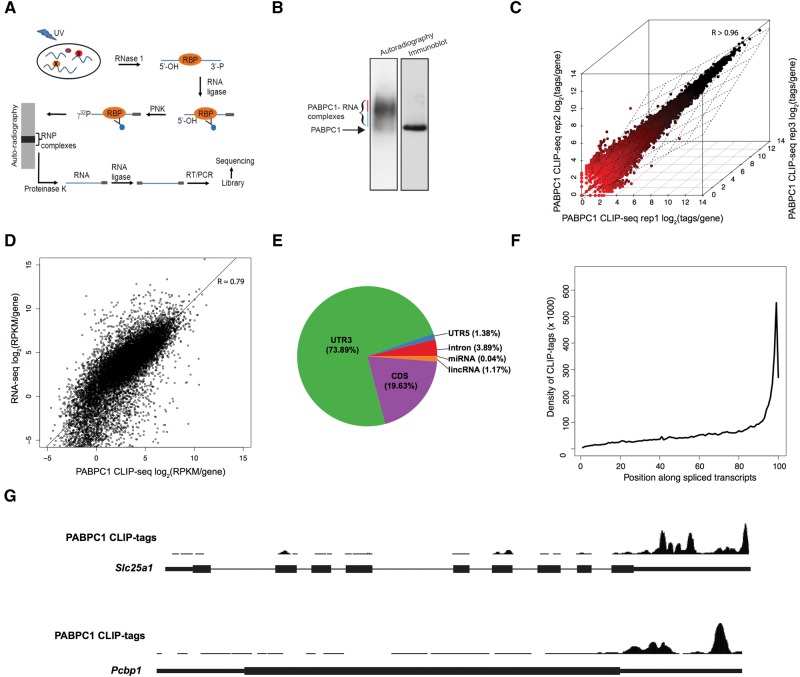
FIGURE 1.
PABPC1 CLIP-seq analysis reveals binding to genomically encoded sequences within murine mRNAs. (A) Schematic of PABPC1 CLIP workflow showing immunoprecipitation and library preparation of PABPC1-bound RNAs for sequencing (see Materials and Methods). (B) Isolation of 32P-labeled PABPC1–mRNP complexes. RNase I trimmed and 32P-labeled RNP complexes were immunoprecipitated with an antibody to PABPC1 and the products were resolved on a denaturing gel. The left lane is an autoradiograph of the immunoprecipitated 32P-labeled PABPC1-RNA complexes and the right lane is an immunoblot of the same gel incubated with antibody to PABPC1. Blue and Red lines indicate PABPC1 monomers and multimers, respectively. (C) Correlation of PABPC1 CLIP-seq replicates. PABPC1 CLIP-seq tags per gene are plotted for three independent biological replicates (Spearman correlation coefficient, R > 0.96 for all comparisons). (D) Correlation of PABPC1 CLIP-seq and RNA-seq from MEL cells. RPKM per gene is plotted for CLIP-seq and RNA-seq (Spearman correlation coefficient, R = 0.792). (E) Pie chart of the distribution of PABPC1 CLIP tags within the transcriptome. (F) Relative distribution of PABPC1 CLIP tags along spliced mRNA transcripts. Gencode mRNAs were binned into 100 evenly sized regions and the coverage at each bin was used to create a composite profile. (G) Screenshots of the UCSC genome browser for two representative mRNAs (Slc25a1 and Pcbp1), showing distribution of PABPC1 CLIP tags along the length of the primary transcript. Note that Pcbp1 is encoded by an intronless gene.

