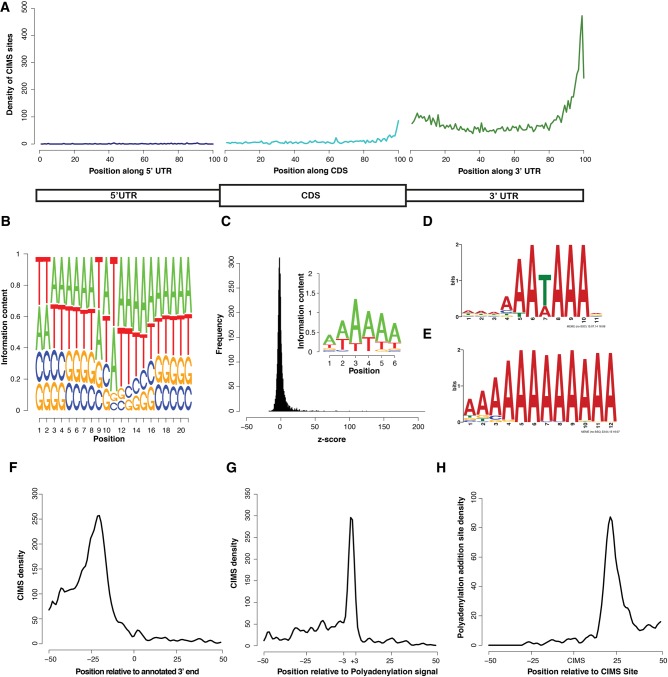
FIGURE 2.
CIMS analysis of PABPC1 CLIP tags reveals direct binding of PABPC1 to the cleavage and polyadenylation signal. (A) Relative distribution profile of CIMS sites along mRNAs. Position-specific coverage was calculated by parsing each region (UTRs and CDS) into 100 distinct bins and calculating CIMS coverage per bin. (B) Logo representing the average nucleotide sequence ±10 nt proximal to the CIMS sites (position 11 represents the CIMS site). (C) Z-score distribution of hexanucleotide analysis of CIMS sites (±15 nt) and a logo representing the 20 most enriched hexanucleotides. (D) Motif logo uncovered by MEME analysis of CIMS sites ±15-nt flanking sequence. (E) Motif logo uncovered by MEME analysis on CIMS sites ±15-nt flanking sequence after removing all possible PAS signal sequences. (F) Absolute distribution of CIMS relative to the end of annotated 3′ UTRs. (G) Absolute distribution of CIMS sites relative to the PAS signal sequence (AAUAAA). (H) Absolute distribution of experimentally determined poly(A) addition sites relative to CIMS sites.

