Figure 2.

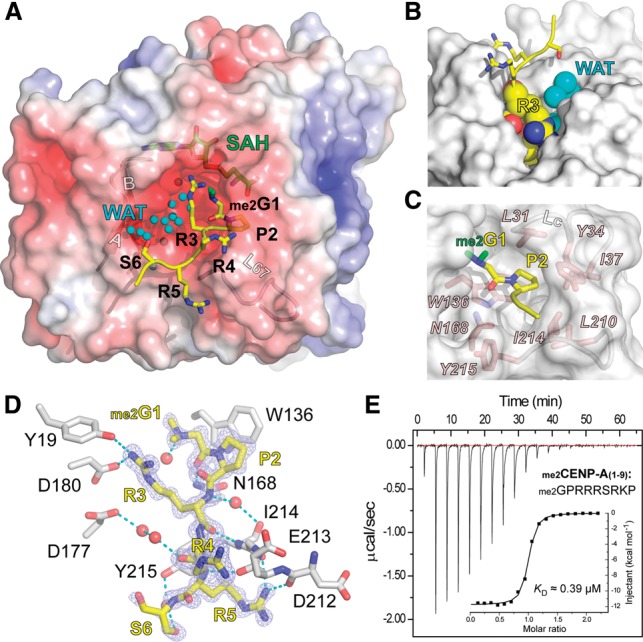
CENP-A peptide recognition by NRMT1. (A) Structure of NRMT1 bound to the dimethylated CENP-A peptide. NRMT1 is in surface view and is colored according to its electrostatic potential as a spectrum ranging from −6 kT/e (red) to +6 kT/e (blue). The CENP-A peptide is depicted as yellow sticks, with the two α-N-methyl groups highlighted in green. Note the two channels that are close to the βAB hairpin and the L67 loop. Waters (WAT) are depicted as smal cyan balls. (B) Burial of the CENP-A “G1–P2–R3” segment in the NRMT1 L67 channel. NRMT1 is represented as a gray surface. Residues G1, P2, and R3 and waters are shown as spheres. Note that the βAB channel is fully occupied with waters (cyan). (C) Pocket composition for “G1–P2” recognition. Key residues of NRMT1 are depicted as pink sticks. (D) Hydrogen-bonding network involved in CENP-A peptide recognition. The Fo–Fc omit map of CENP-A is contoured at the 2.5 σ level. Waters are depicted as red balls, and hydrogen bonds are shown as cyan dashes. (E) Calorimetric titration and fitting curves of N-dimethylated CENP-A titrated into NRMT1.
