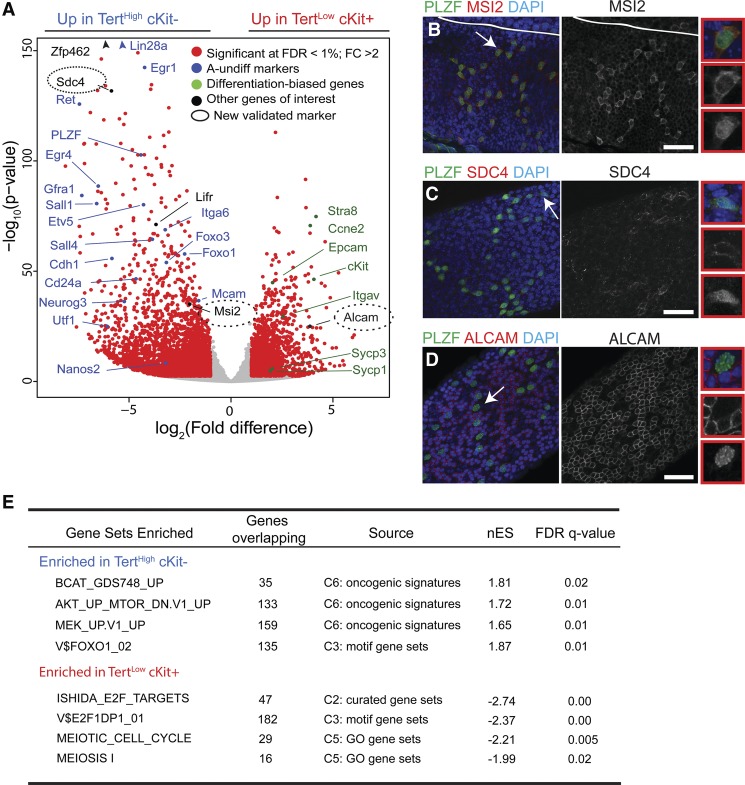
Figure 4.
Transcriptional landscape of adult spermatogonial subtypes. (A) Volcano plot of expression profiles comparing TertHigh cKit− with TertLow cKit+ cells. Genes whose expression significantly differs between the populations are labeled in red (FDR threshold 1%, twofold change threshold). Genes in blue are undifferentiated (A-undiff) markers from the literature. Genes in green are differentiated-biased markers from the literature. The entire list of differentially expressed genes is reported in Supplemental Table S1. (B) Whole-mount analysis of adult seminiferous tubules stained for MSI2 and PLZF. Bar, 50 μm. (C) Whole-mount analysis of adult seminiferous tubules stained for SDC4 and PLZF. Bar, 50 μm. (D) Whole-mount analysis of adult seminiferous tubules stained for ALCAM and PLZF. Bar, 50 μm. B–D represent multiple independent mice. (E) Gene set enrichment analysis (GSEA) of genes up-regulated in TertHigh cKit− or TertLow cKit+ cells against a database of curated gene sets. Selected significant signatures are shown. The entire GSEA is reported in Supplemental Table S1.

