
Figure 6.
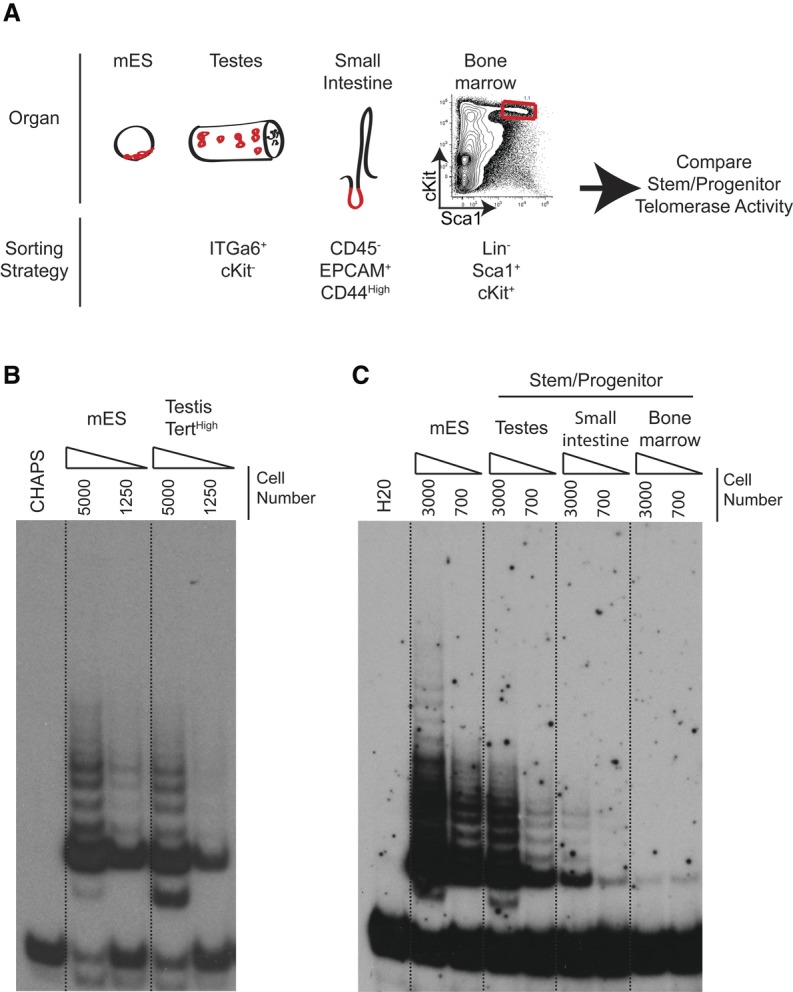
Marked down-regulation of telomerase activity in somatic progenitor cells compared with germline progenitor cells. (A) Experimental overview. Telomerase activity was compared between identical numbers of progenitor cells of the indicated immunophenotypes isolated from different tissues. (B) Telomerase assays by TRAP using identical numbers of TertTomato/+ mES cells and TertHigh testis cells from TertTomato/+ mice. Dilutions represent 5000 and 1250 cell equivalents. Results representative of four independent experiments are shown. (C) Telomerase assays by TRAP using FACS-purified cells of the indicated immunophenotypes from wild-type mice compared with wild-type ES cells. Dilutions represent 3000 and 700 cell equivalents, respectively. Representative results of three biological replicates are shown.