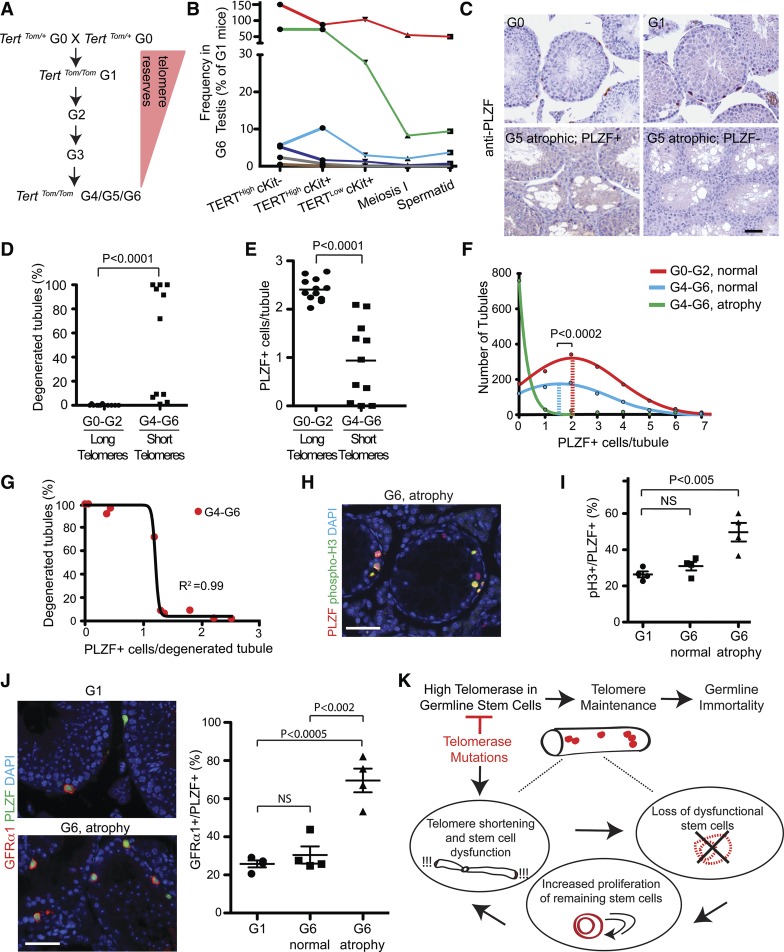
Figure 7.
Telomere dysfunction depletes undifferentiated spermatogonia and induces tubular degeneration. (A) Overview of generational mating strategy used to generate Tert-Tomato reporter mice with telomere dysfunction. (B) Flow cytometry-based quantification of the indicated germ cell populations within the G1 and G6 testes. The total number of events for each G6 mouse was normalized to a G1 control mouse. Data points arising from the same mice are graphed in the same color. (C) PLZF staining on testes cross-sections from Tert knockout mice of the indicated generation. Bar, 50 μm. (D,E) Quantification of the extent of tubular degeneration (D) and the average number of PLZF+ cells per tubule (E) in generation 0–2 and generation 4–6 Tert knockout mice. The P-value is from the Mann-Whitney test. n = 11–12 mice per condition. (F) Histogram of PLZF+ cells per normal tubule and per dysfunctional tubule in generation 0–2 and generation 4–6 Tert knockout mice. The line shows the nonlinear regression curve fitting the data. Mean is indicated with a dashed line. The P-value is from the Mann-Whitney test. (G) Relationship between PLZF+ cell number per tubule cross-section and the percent of tubules showing degeneration in each G4–G6 Tert knockout mouse. The line indicates a sigmoidal curve with a variable slope fitting the data. n = 11 mice. (H) Phosphorylated histone 3 (pH3) expression in G6 atrophic tubules. Bar, 50 μm. (I) Quantification of proliferative status from H. n = 4 mice per condition. The P-value is from the unpaired two-tailed t-test. n = 4 mice per condition. (J) GFRα1 staining in early-generation and late-generation mice. Quantification of GFRα1+ cells per PLZF+ cell. n = 4 mice per condition. The P-value is from the unpaired two-tailed t-test. (K) Model for how telomerase expression in GSCs promotes germline immortality and how telomerase mutations interrupt GSC maintenance.

