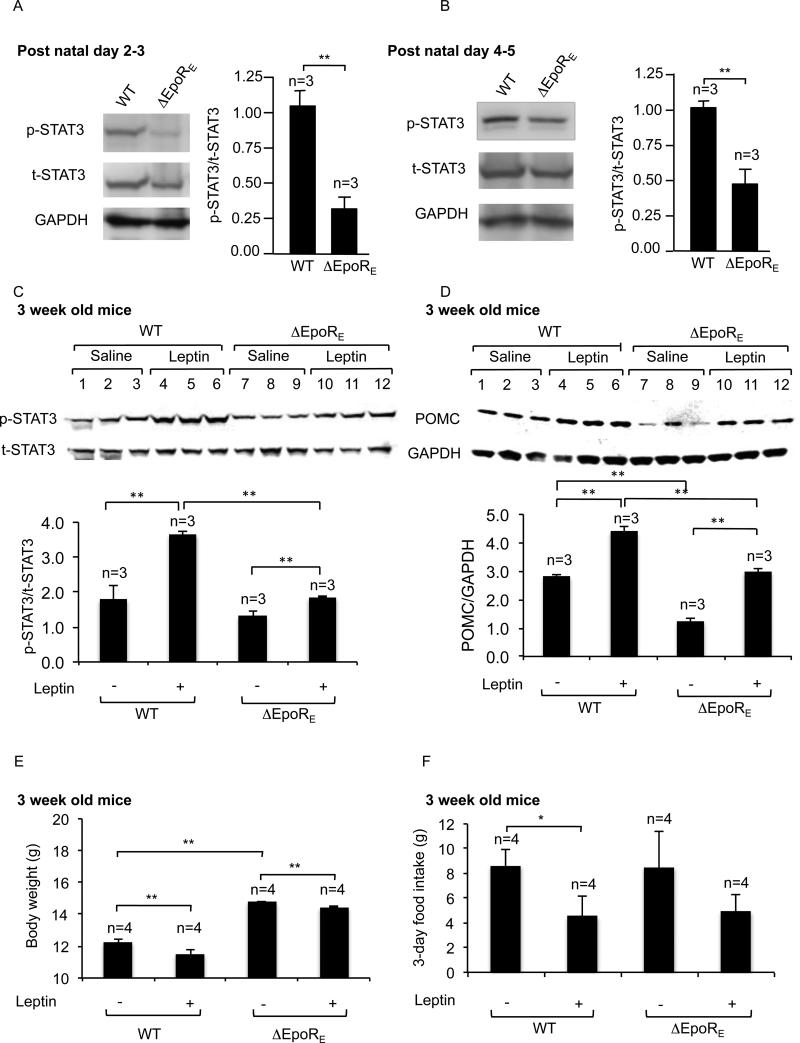
Figure 4. ΔEpoRE-mice show blunted STAT3-activation but equivalent POMC induction in the hypothalamus after leptin treatment, compared to WT-mice.
(A-B) Western blotting and quantitative densitometry analysis (from 3 pups each of WT and ΔEpoRE) were used to compare phosphorylated-STAT3 (p-STAT3), total-STAT3 (t-STAT3), and GAPDH protein levels in WT and ΔEpoRE pups at postnatal day 2-3 (A) and postnatal day 4-5 (B). (C-D) Western blotting and quantitative densitometry analysis demonstrating phosphorylated-STAT3 (p-STAT3) and total-STAT3 (t-STAT3) (C), POMC and GAPDH (D) in 3 week-old female WT and ΔEpoRE mice 45 mins after treated with leptin (5 mg/kg body weight) or saline (n=3 for each treatment group). (E-F) Body weight (E), and food intake (F) were determined in WT and ΔEpoRE mice after saline- or leptin-treatment twice daily for 3 days (n=4 for each treatment group). Statistical significance is indicated by *p<0.05, and **p<0.01 001 (one-way ANOVA followed by Bonferroni correction).

