
Fig. 1.
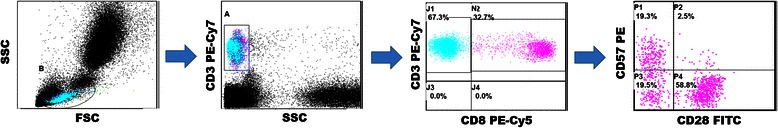
Representative dot plots for the delineation of the different subpopulations by flow cytometry, By combining side (SSC) versus forward scatter (FSC), and CD3 fluorescence versus SSC plots, CD3+ cells were identified. CD8+ cells were obtained from the pure CD3+ population, and were further subdivided based on the expression of CD28 and CD57