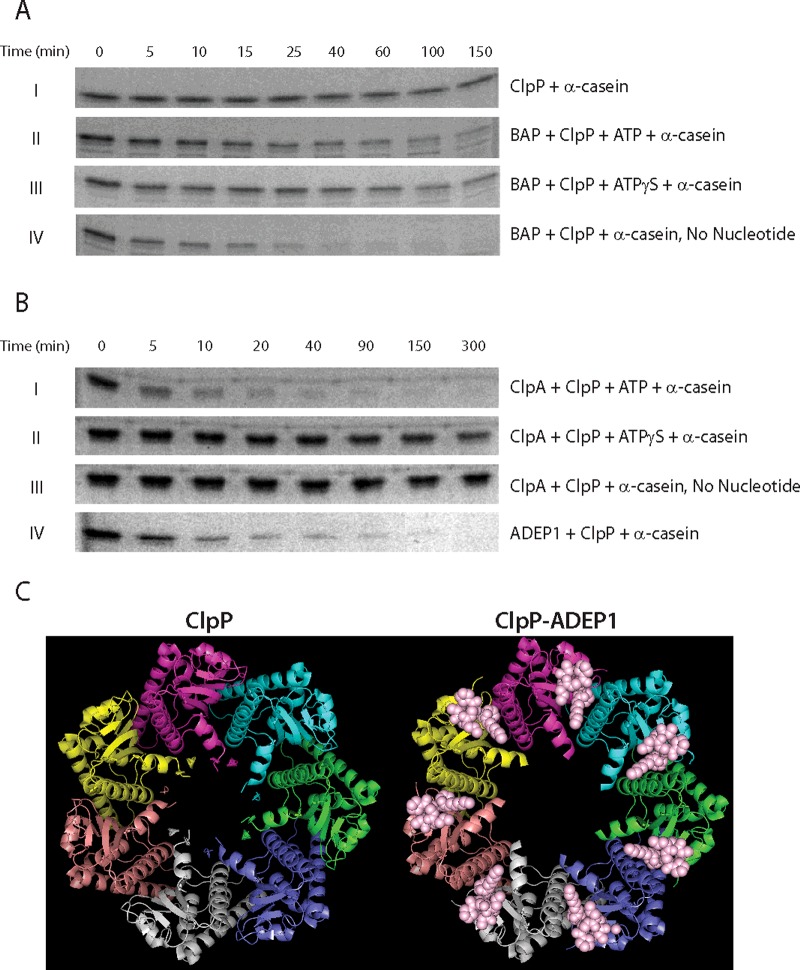
Figure 2. Introduction of the IGL loops into ClpB dysregulates ClpP and induces non-specific proteolysis.
(A) SDS/PAGE images for 3 μM α-casein in buffer H50 at 25°C in the presence of (I) 3 μM ClpP, (II) 10 μM BAP, 3 μM ClpP and 5 mM ATP, (III) 10 μM BAP, 3 μM ClpP and 5 mM ATPγS and (IV) 10 μM BAP and 3 μM ClpP. (B) SDS/PAGE images for 3 μM α-casein in buffer H300 at 25°C in the presence of (I) 3 μM ClpA, 3 μM ClpP and 5 mM ATP, (II) 3 μM ClpA, 3 μM ClpP and 5 mM ATPγS, (III) 3 μM ClpA and 3 μM ClpP and (IV) 5 μM ADEP1 and 3 μM ClpP. Degradation was examined at each indicated time point. (C) Top view of heptameric ClpP (left, PDB ID code 3KTG) and ClpP–ADEP1 complex (right, PDB ID code 3KTI). Each ClpP monomer is colour-coded. ADEP1 is represented in pink spheres in the ClpP–ADEP1 complex. Both images were prepared using PYMOL (the PyMOL molecular graphics system, version 1.5.0.4 Schrodinger, LLC).

