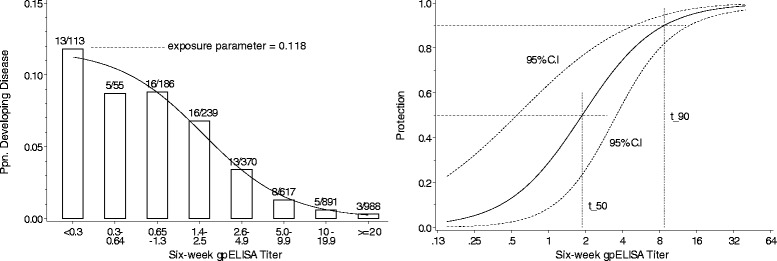
Fig. 1.

Scaled logit model fitted to the White/varicella data [23]. Left panel: Bars show the number and proportion of subjects who developed disease in each interval of assay value; curve is estimated probability of disease. Right panel: Estimated protection curve with 95 % confidence interval for protection and estimates of assay values at which protection is 50 % and 90 %
