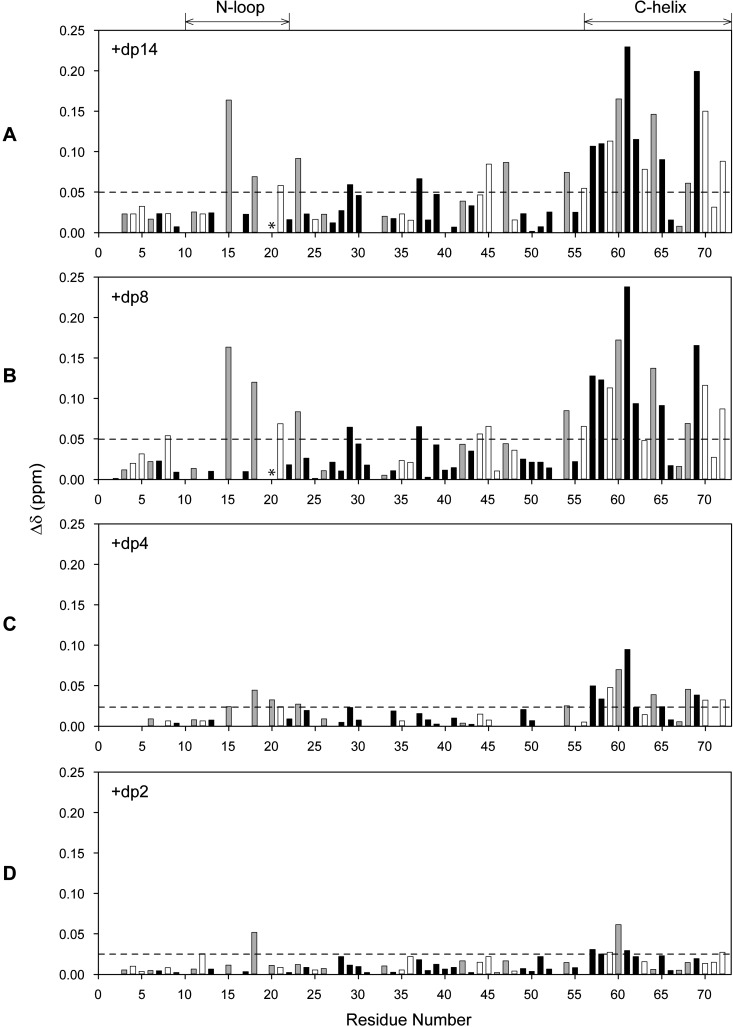
Figure 2. Histogram plots of CXCL8 dimer binding to heparin oligosaccharides.
CSP profiles of CXCL8 dimer binding to heparin dp14 (A), dp8 (B), dp4 (C) and dp2 (D). Basic residues lysine, arginine and histidine are shown as grey bars and buried residues (ASA < 40%) are shown in black. Residues showing CSP higher than the threshold (indicated by the dotted lines) are considered as involved in binding. Lys20 broadens out during the titration and is indicated by *.

