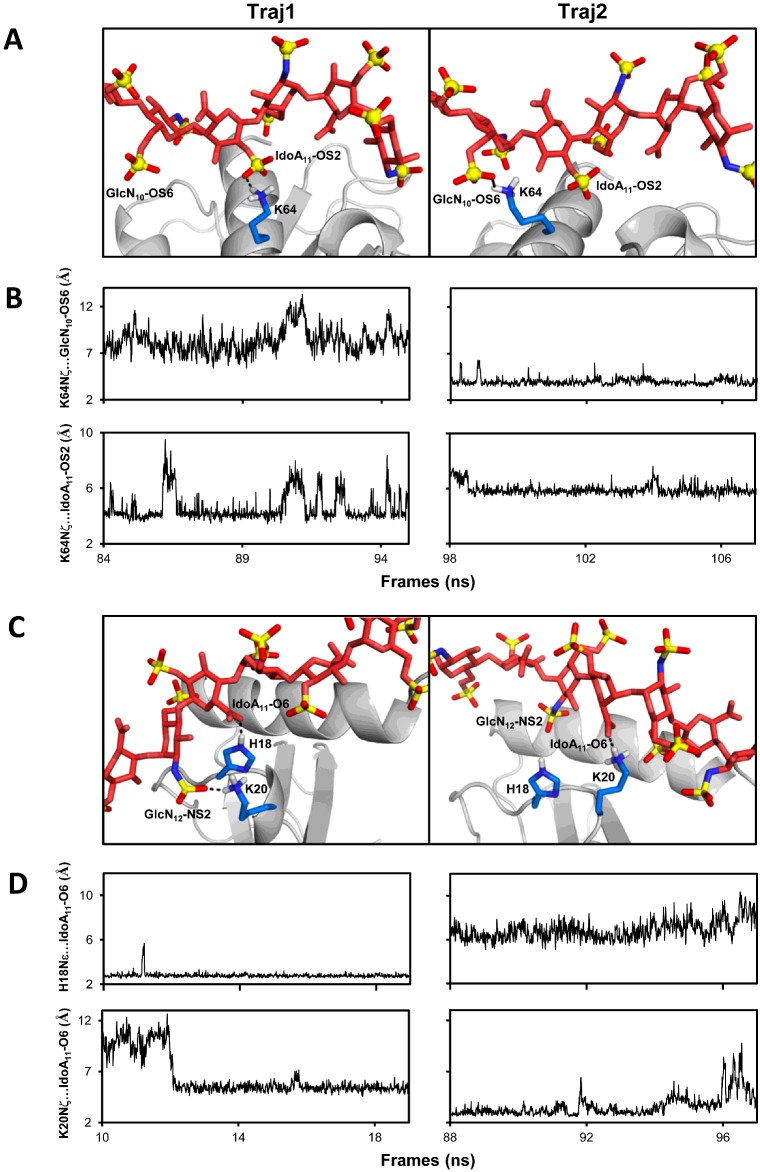
Figure 7. Dynamic nature of the binding interface from MD simulations.
(A) Snapshots from two ∼10 ns stretches (Traj1 and Traj2) of the MD simulations of the CXCL8D dp14(⊥) showing hydrogen-bond partners of Lys64 NζH3+ switching between IdoA11–OS2 and GlcN10–OS6. (B) The distances between Lys64Nζ and the sulfates for Traj1 and Traj2 illustrate the interchange of interacting partners. (C) Snapshots from two ∼10 ns stretches (Traj1 and Traj2) of CXCL8M–dp8(//) simulations showing IdoA11(COO−) switching hydrogen-bond partners between His18 and Lys20 side chains and Lys20 exchanging between IdoA11(COO−) and GlcN12 (NS2). (D) The differences in distance of IdoA11(COO−) from His18 and Lys20 side chains during Traj1 and Traj2 illustrate the dynamic interplay. For clarity, only residues Lys64 in (A) and His18 and Lys20 in (C) are shown as sticks at the interface.

