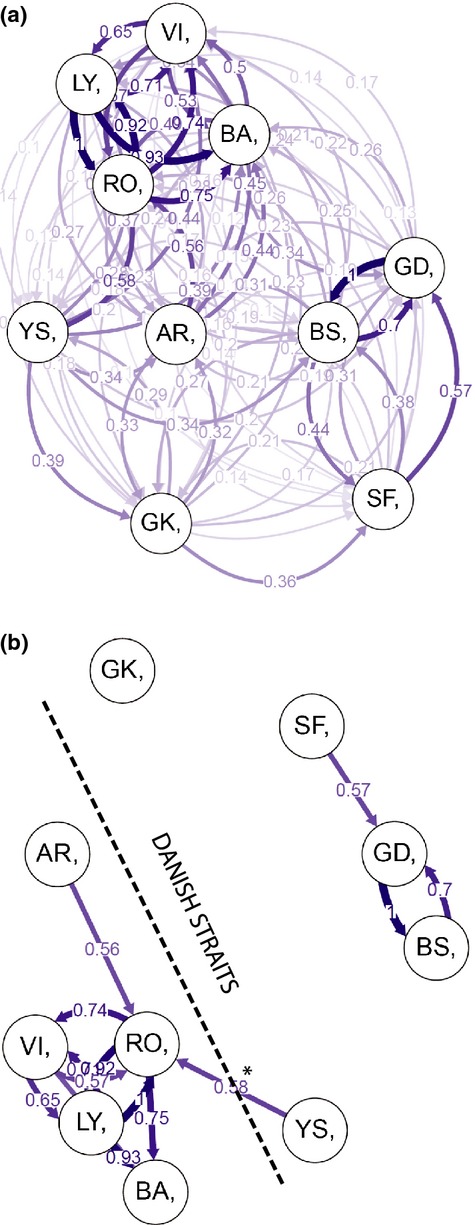
Fig. 5.

(a) The directional relative migration network including all relative migrations values indicates stronger gene flow within the subareas than between. (b) Directional relative migration network displaying relative migrations above 0.5. The direction of the relative migration between RO and YS was significantly asymmetric (*CI 95%).
