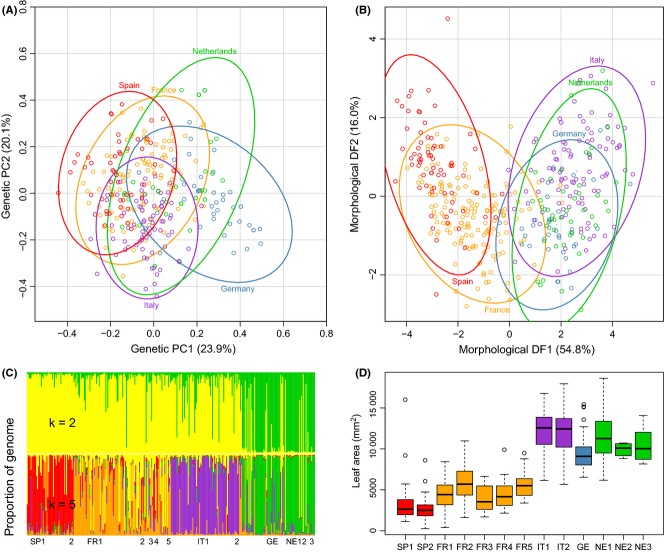
Fig. 2.
(A) Principal coordinates analysis of microsatellite data reveals patterns of differentiation among populations of Populus nigra. (B) Discriminant classification analysis of 12 morphological traits reveals significant geographic structuring to phenotypic variation in Populus nigra. Each point represents a single genet, with colour corresponding to country of origin. Ellipses represent the 95% confidence intervals for the population means. Population means for each data type were used for pairwise comparisons in full and partial Mantel tests. (C) Admixture analysis of microsatellite data identified two (top) or five (bottom) genetic groups. Assignment of individual trees (vertical bars) roughly corresponded to geographic origin, with samples from France displaying greater admixture. Position of abbreviations below indicates the order and extent of each population. (D) Morphological differentiation among populations is typified by variation in leaf area quantified in a common garden study. Each box-and-whisker plot represents the observed measures for each population, with the centre bar indicating the median value.

