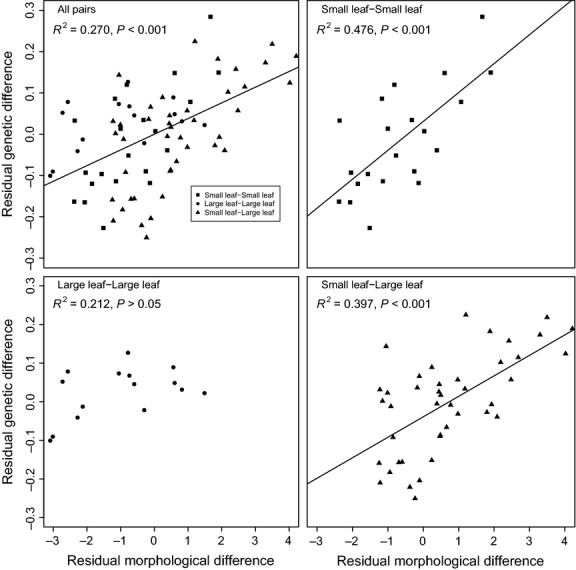
Fig. 4.

Partial regression plots illustrating correlated genetic and morphological differences between populations of Populus nigra after controlling for the effects of geographic distance. Points represent pairwise comparisons between two small-leaf populations (squares), two large-leaf populations (circles) or populations with differing morphology (triangles). Lines represent significant regressions of the residuals, with significance determined using anova. Comparisons of large-leaf to large-leaf populations revealed no significant relationship. Significance did not change after Bonferroni corrections.
