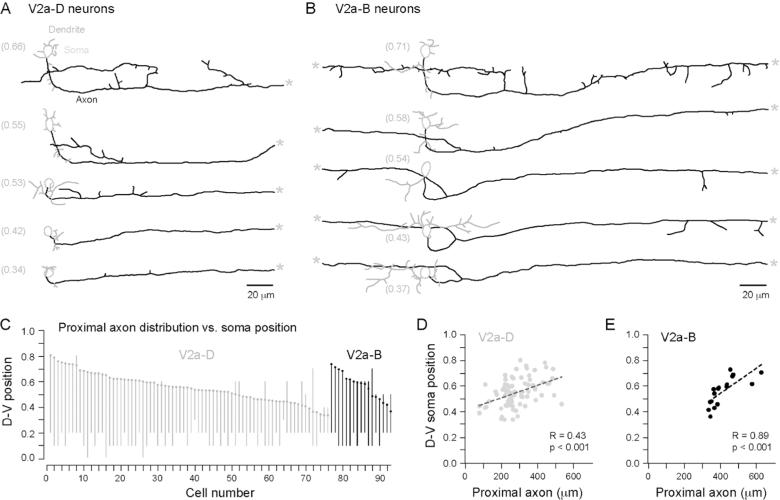
Figure 4. Proximal arborization length is related to somatic dorso-ventral location.
(A) Reconstructions of V2a-D cells arranged from top to bottom according to their dorso-ventral location (noted parenthetically to the left). The main axons and collaterals (black), presumed dendrites (grey) and somata (dotted grey line) are indicated. Dendrites were defined according to criteria specified in (Li et al., 2001). A grey asterisk marks where the main axon exits the field of view.
(B) As in A, but for V2a-B cells.
(C) Ball and stick plots illustrating dorso-ventral (D-V) soma position and the distribution of local axon arborization for both classes (n = 93). Cells for which we could not obtain accurate measures of D-V axon position are not included (e.g., at the transition to the hindbrain, rostral to segment 5). The lines represent the maximum and minimum D-V position at which any part of the axon was observed, up to 100 μm rostral and 200 μm caudal from the soma. V2a cells tend to innervate areas at and below their somatic dorso-ventral position.
(D) A comparison of D-V soma position versus proximal axon length reveals a significant relationship for V2a-Ds (n = 76).
(E) As in D, but for V2a-Bs (n = 17).

