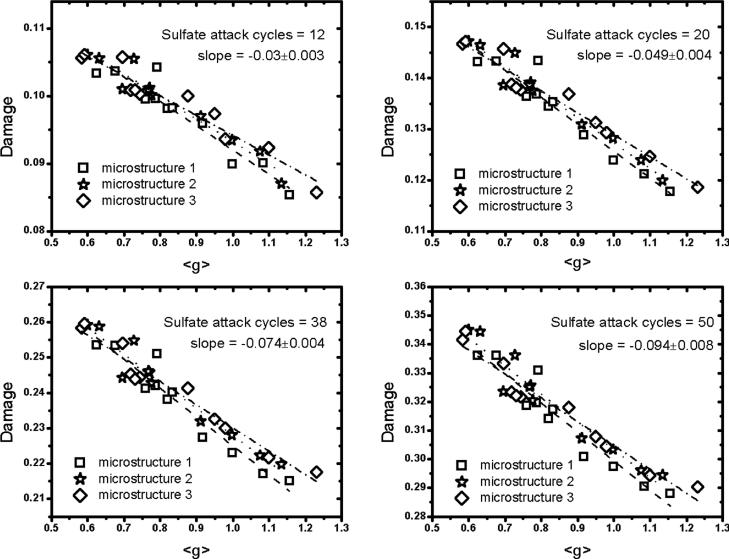
Figure 9.
Damage after different sulfate flushing cycles as a function of 〈g〉 for water near monosulfate domains. In each plot, different symbols are associated with different realizations of the same starting microstructure. Least-squares linear regression was used to obtain the slope (dashed lines) for each microstructure realization, and the mean slope and standard uncertainty (1-σ) are displayed.

