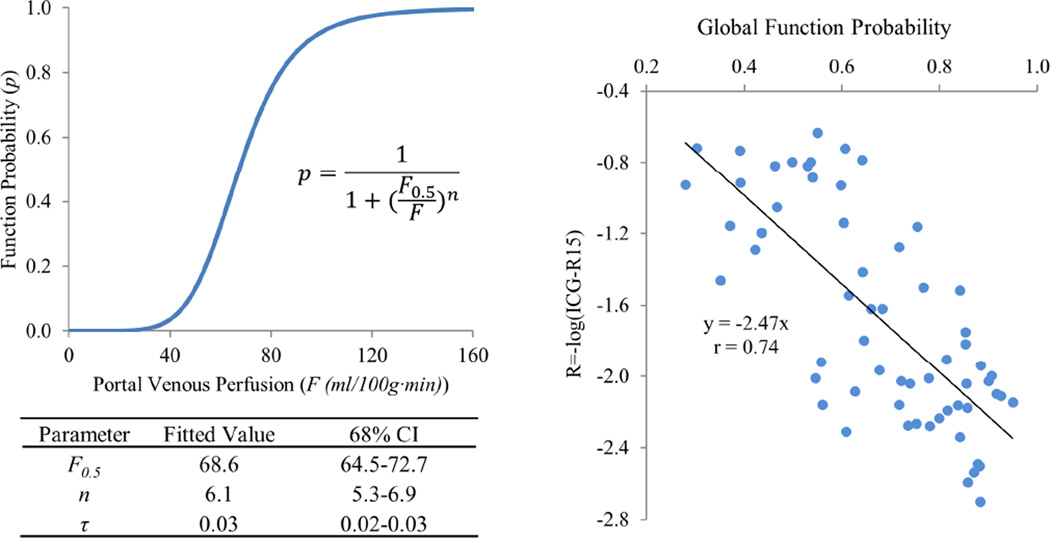
Figure 2.
(Left) The local function probability as a function of portal venous perfusion value with the best fitted parameters; (Right) scatter plot of the global liver functions derived from the local function probabilities of the subunits and measured by log(ICG-R15). The solid line represents the fitted line with a slope of −2.47 and r=0.74.

