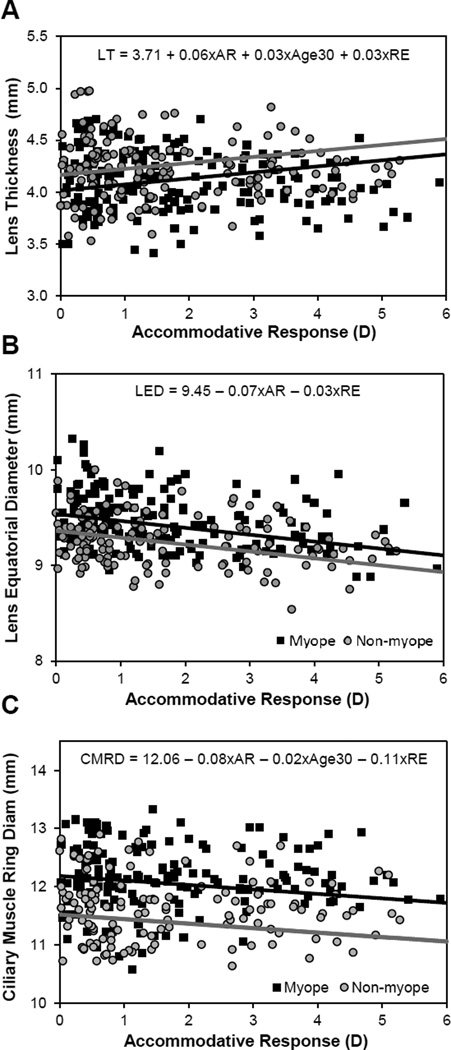
Figure 4.
Multivariate models of lens and ciliary muscle changes with accommodative response (AR), refractive error (RE) and age. In each plot, two regression lines were fitted holding age constant at age 40 years to visualize differences with refractive error and accommodation. The black lines illustrate a −3D myope and the grey line a +3D hyperope).

