
Figure 2.
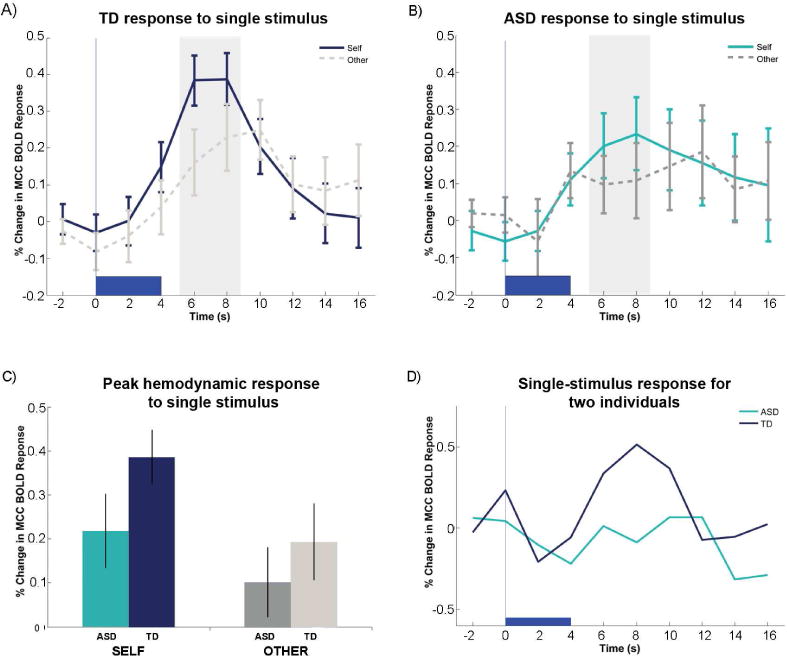
A) Time series for single stimulus presentation averaged over typically developing (TD) children (n=38), and B) Autism Spectrum Disorder (ASD) (n=22) children. C) Peak Hemodynamic for ASD and TD for single stimulus “self” and “other” images D) Hemodynamic responses to single stimulus self-images for single ASD and TD individuals. Trajectories for all participants can be found in Figure S2.