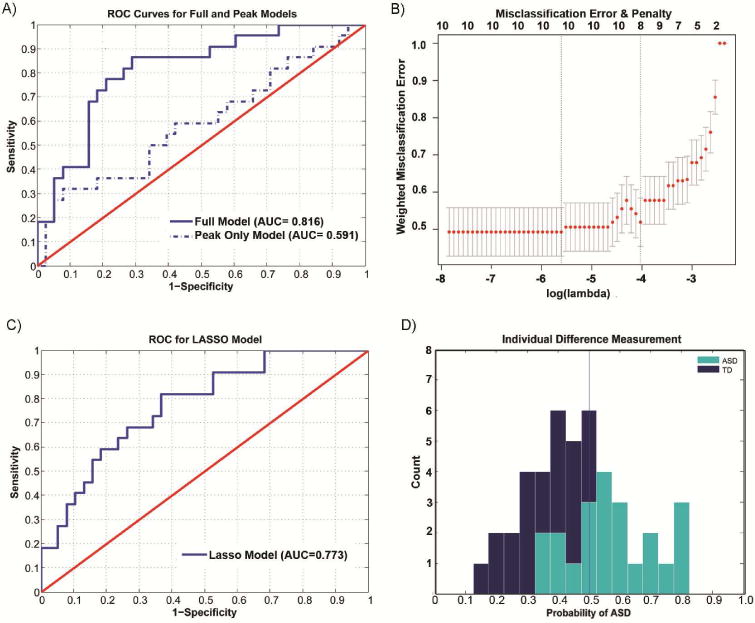
Figure 3.

Differences in BOLD MCC responses to single stimulus “self” images classifies individual subjects. A) ROC curves for a ‘full’ logistic model and a model based on averaging peak responses. B) Misclassification error versus penalization in penalized logistic regression model. Lambda (bottom horizontal axis) is the amount of penalization. The top of the plot shows the number of variables (i.e., degrees of freedom) included in the model as penalization changes. Less penalization, log(λ), results in more degrees of freedom. Two vertical lines are plotted; the left line (“min”) is the penalization that produced minimal misclassification error. The right line is the penalization (“1se”) that is within one standard cross-validation error of the minimum error. λ is selected using the “1se” rule as the error are statistically equivalent, but the model is more parsimonious C) ROC curves for a penalized logistic regression model using a Leave –One – Out Cross Validation. The penalized cross validated model utilizes only data from 8 covariates. D) Histograms of Individual Difference measure, p(status=ASD|M), given the penalized model (M). The D’ between the ASD and TD cohorts is 1.50 for the single shot measurements and 1.61 for the full model.
