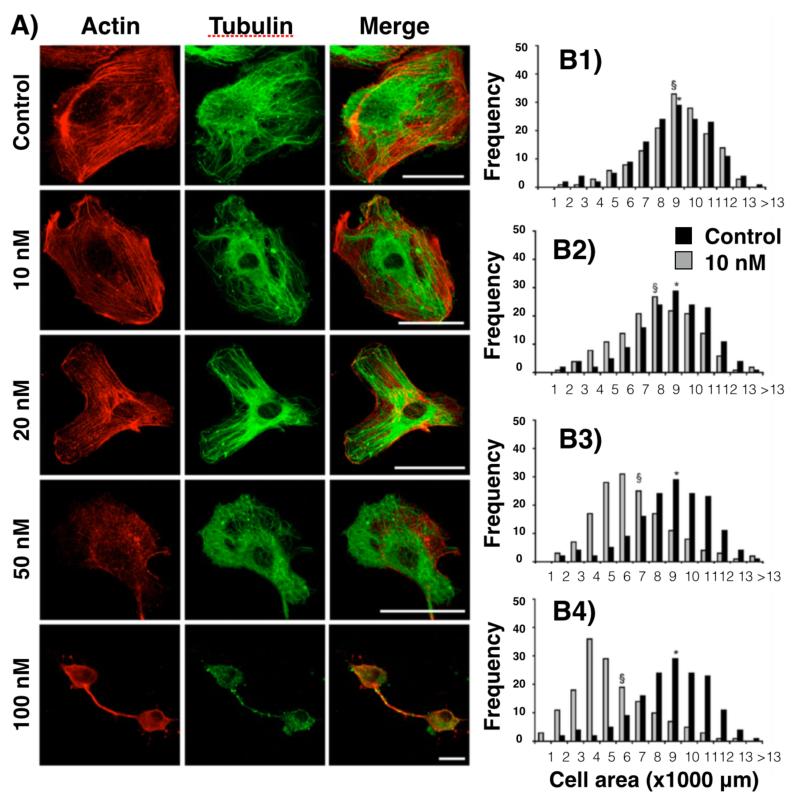
Figure 6.
A) Representative confocal images of control HUVECs or cells exposed to 10, 20, 50, or 100 nM GNP for 24 h at 1 day post-NP-labeling. The left column depicts actin staining (red), the middle column depicts α-tubulin (green), and the right column is a merged image of both actin and α-tubulin. Scale bars: 50 μm. B) Histograms representing the cell areas of control cells (dark gray) and cells incubated for 24 h with GNPs at 10 nM (B1), 20 nM (B2), 50 nM (B3), and 100 nM (B4). The average cell area is indicated with (*) for control cells and with (§) for NP-treated cells. Figure with permission from (67).

