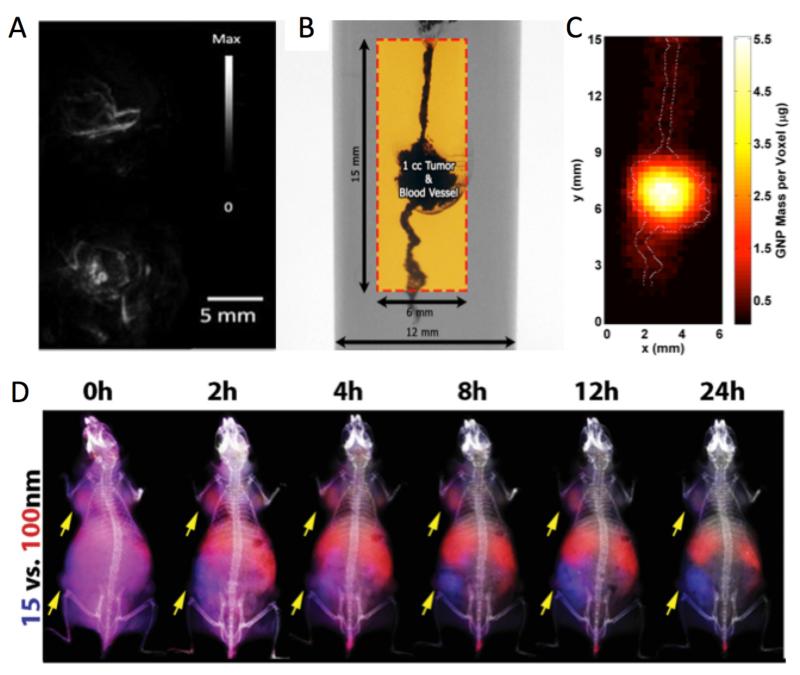
Figure 7.
A) Photoacoustic images of tumors in vivo before (top) and 6 h after (bottom) intravenous administration of gold nanorods documenting extravasation of nanoparticles from vasculature to tumor parenchyma. Reproduced with permission from reference (77). B) XFCT imaging phantom with simulated GNPladen blood vessel and ~1 cm3 tumor. The box shows the region of interest that was imaged. C) 2-D x-ray fluorescence image of the region of interest within the XFCT imaging phantom. The GNP distribution within the simulated tumor region and blood vessels is shown, with the maximum value of ~5.5 μg. The outline of the irradiated GNP-containing structures is overlaid on the fluorescence image, showing a good match between the images around the tumor region, with permission from reference (78). D) Fluorescence image guided biodistribution studies with GNPs of MDA-MB-435 tumors (yellow arrows) in mice injected simultaneously with 15 nm (blue fluorescence) and 100 nm (red fluorescence) GNPs which were coated with PEG 5kDa, and fluorescently Figure 7 labelled with Kodak X-Sight 670 and Alexa Fluor 750, respectively,) with permission from reference (34).

