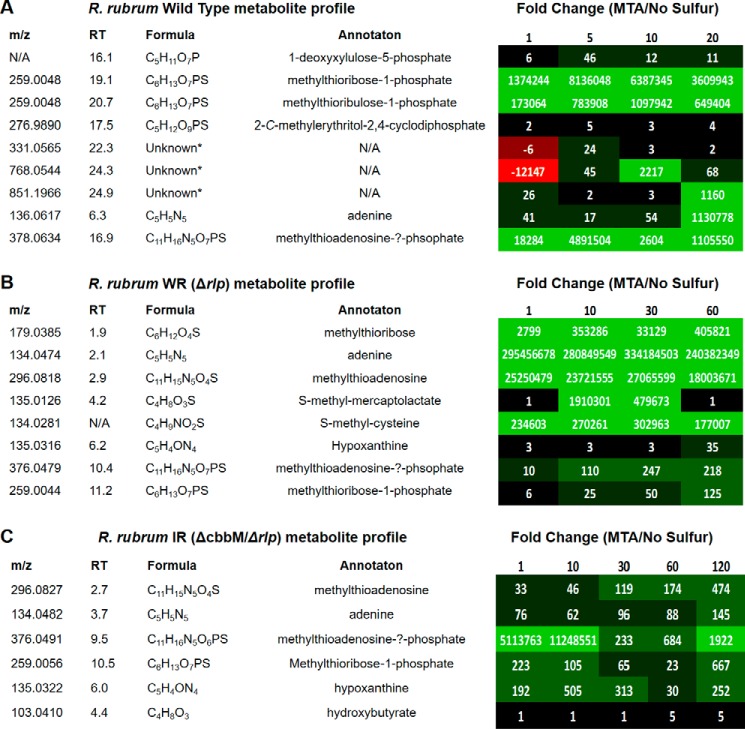
FIGURE 6.
Knock-out metabolomics analysis of R. rubrum strains. A–C, wild type (A), WR (ΔrlpA) (B), and IR (ΔcbbM/ΔrlpA) (C). The -fold change for each identified metabolite represents the relative metabolite concentration in cells fed with MTA versus no sulfur source under anaerobic conditions. Each column represents the time (min) after feeding. N/A, not applicable; RT, retention time.

