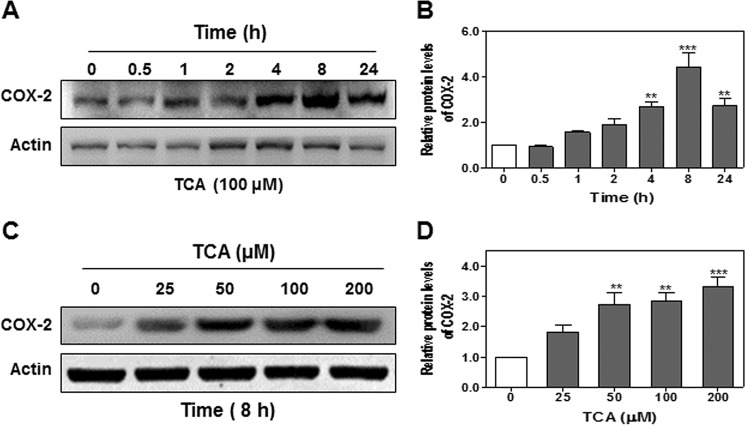
FIGURE 1.
The effect of TCA on COX-2 expression in HuCCT1 cells. Cells were cultured in serum-free medium overnight and then treated with either 100 μm TCA for different time periods (0–24 h) or different concentrations of TCA (0, 25, 50, 100, or 200 μm) for 8 h. At the end of each treatment, cells were harvested and protein levels of COX-2 were detected by Western blot analysis. A and C, representative images of the immunoblots for COX-2 and actin are shown. B and D, relative densities of COX-2 were analyzed using Quantity One software using actin as a loading control. Values represent the mean ± S.E. of three independent experiments. Statistical significance relative to the vehicle control: **, p < 0.01; ***, p < 0.001.

