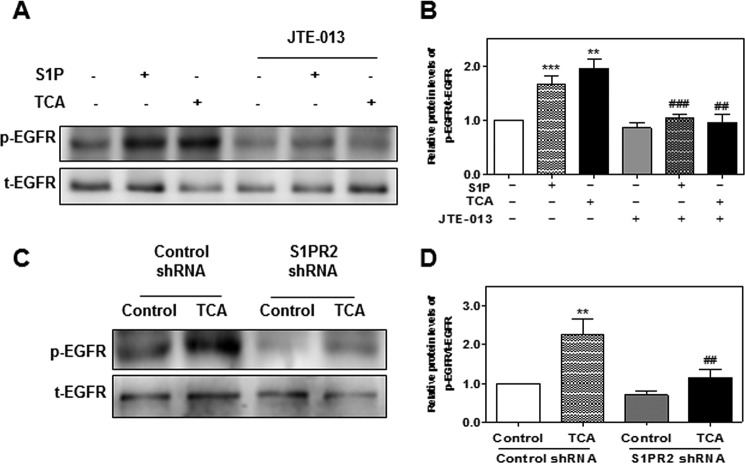
FIGURE 10.
The role of S1PR2 in TCA-induced EGFR transactivation in HuCCT1 cells. A and B, cells were cultured in serum-free medium and pretreated with JTE-013 (10 μm) for 1 h, and then treated with S1P (100 nm) or TCA (100 μm) for 15 min. C and D, HuCCT1 cells were transfected with control shRNA or S1PR2 shRNA for 48 h and then treated with TCA (100 μm) for 15 min. At the end of treatment, total protein was isolated. Protein levels of p-EGFR and t-EGFR were detected by Western blot analysis. A and C, representative images of the immunoblots for p-EGFR and t-EGFR are shown. B and D, relative protein levels of p-EGFR/t-EGFR were calculated from three independent experiments. Values represent the mean ± S.E. of three independent experiments. Statistical significance relative to the vehicle control: **, p < 0.01; ***, p < 0.001; relative to the S1P or TCA treatment group: ##, p < 0.01; ###, p < 0.001.

