FIGURE 1.
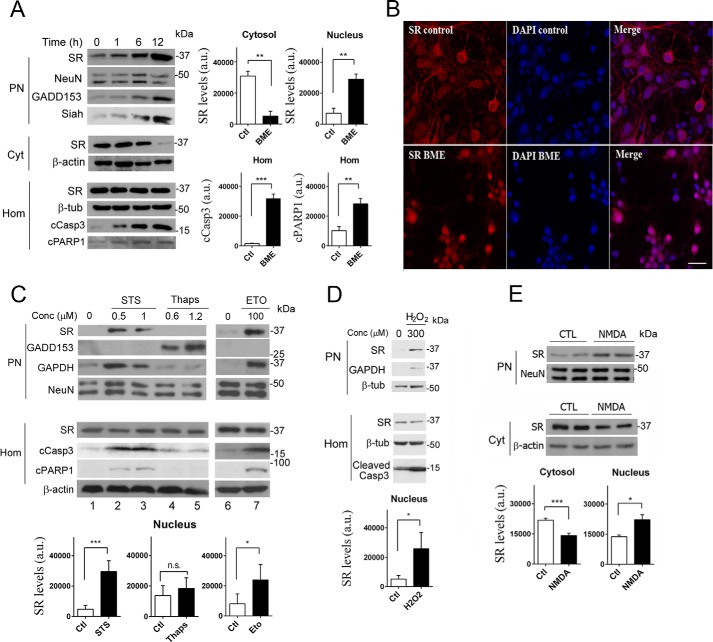
Translocation of SR to the nucleus upon cell death insults. A, primary cortical neuronal cultures (DIV10) treated with 4 mm BME display increased levels of SR in the purified nuclear fraction, associated with a pronounced reduction in cytosolic SR (Cyt) monitored by Western blot analysis. BME did not change SR levels in total homogenate (Hom). SR translocation was associated with induction of GADD153 expression, and a concomitant increase in Siah at the PN. Cell death induction was determined by cleavage of caspase 3 (cCasp3) and PARP1 (cPARP1) monitored in the homogenate fraction. Loading controls NeuN (PN), β-actin (Cyt), and β-tubulin (Hom) were unchanged. Graphs depict the densitometric quantification of SR normalized for loading controls in the cytosol and purified nucleus or the levels of cCasp3 and cleaved poly(ADP-ribose) polymerase 1 in homogenates, monitored after 12 h in the absence or presence of BME. The data represent the average ± S.E. of five independent experiments with different culture preparations. B, primary neuronal cultures express SR (red) in the cytosol and neuronal processes as shown by confocal laser microscopy (upper panels). A 10-h treatment with BME elicited translocation of SR to the nucleus where it co-localized with DAPI (blue), which labels cell nuclei (lower panels). Scale bar, 20 μm. The panels represent three experiments with different culture preparations. C, treatment of neurons with staurosporine (STS) or etoposide (ETO) for 8 h elicited similar effects as BME, without inducing the ER stress marker GADD153. Conversely, a 10-h treatment with thapsigargin (thaps) induced GADD153 expression but without eliciting SR translocation or cleavage of caspase 3 or PARP1. Graphs depict the densitometric quantification of SR normalized for loading controls in purified nucleus with and without the different treatments. The data represent the average ± S.E. of 11 (1 μm STS), 5 (1.2 μm thapsigargin), and 4 (100 μm etoposide) independent experiments with different culture preparations. D, neurons treated with H2O2 for 2 h, after which the medium was replaced, and cellular fractions were analyzed after 8 h. Graph depicts the densitometric quantification of SR normalized for loading controls in purified nucleus with and without H2O2. The data represent the average ± S.E. of three independent experiments with different culture preparations. E, NMDAR activation induced SR accumulation in the nucleus; neurons were treated with 100 μm NMDA for 30 min, and the medium was replaced and cellular fractions analyzed after 8 h. Graphs depict the densitometric quantification of SR normalized for loading controls in cytosol and purified nucleus, in the absence or presence of NMDA. The data represent the average ± S.E. of five independent experiments with different culture preparations. CTL, control. ***, **, *, different from control at p < 0.001, 0.01, and 0.05, respectively. n.s., not significantly significant.

