FIGURE 1.
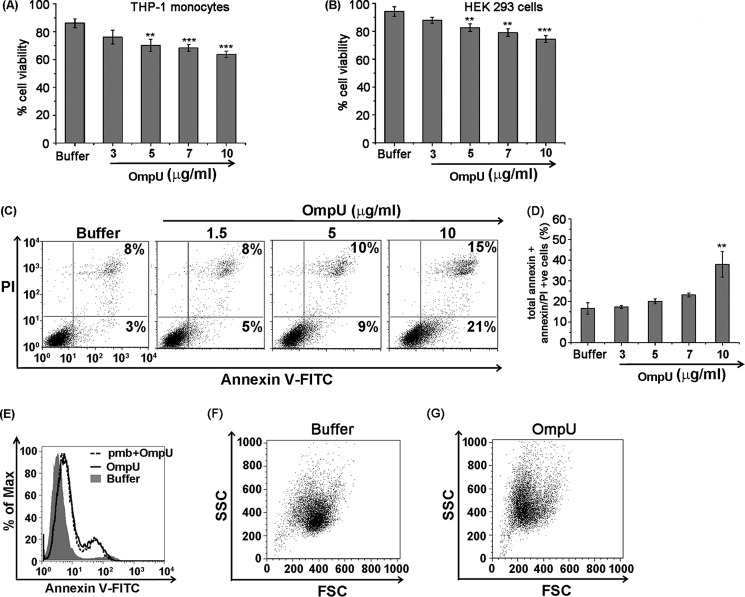
OmpU induces apoptosis-like features in THP-1 monocytes and HEK 293 cells. A and B, bar graphs showing OmpU-induced cell death measured as a loss of cell viability by an MTT assay in target cells. THP-1 monocytes (A) and HEK 293 (B) cells were exposed to different doses of OmpU for 24 h and subjected to an MTT assay to assess their cell viability. Bar graphs represent mean ± S.E. (error bars) of the percentage of cell viability calculated using values from three independent experiments. *, p < 0.05; **, p < 0.01; ***, p < 0.001 versus buffer control for all of the doses. C, dot plots showing increase in total annexin V single positive + annexin V/PI double-positive population with increasing doses of OmpU treatment. THP-1 cells were treated with different doses of OmpU and incubated for 24 h. Cells were harvested and stained with annexin V-FITC and PI (dot plots are representative of three or more independent experiments). D, bar graphs showing an increase in the percentage of total annexin V single-positive + annexin V/PI double-positive cells with increasing doses of OmpU. Shown are the mean ± S.E. percentages of total annexin V single-positive + annexin V/PI double-positive cells for three or more independent experiments. *, p < 0.05; **, p < 0.01; ***, p < 0.001 versus buffer control for all of the doses. E, histogram plot showing that LPS does not contribute to OmpU-mediated PCD. THP-1 monocytes were pretreated with or without polymyxin B, followed by treatment with 10 μg/ml OmpU or buffer for 24 h. Treated cells were stained with annexin V-FITC and PI and analyzed by flow cytometry. A histogram overlay shows a comparison of annexin V-positive plus annexin V/PI double-positive population between polymyxin B + OmpU- and OmpU-treated cells. F and G, dot plots showing that OmpU induced cell shrinking and increased cell granularity in OmpU- and buffer-treated THP-1 monocytes as analyzed by flow cytometry under the parameters of forward scatter (FSC) and side scatter (SSC).

