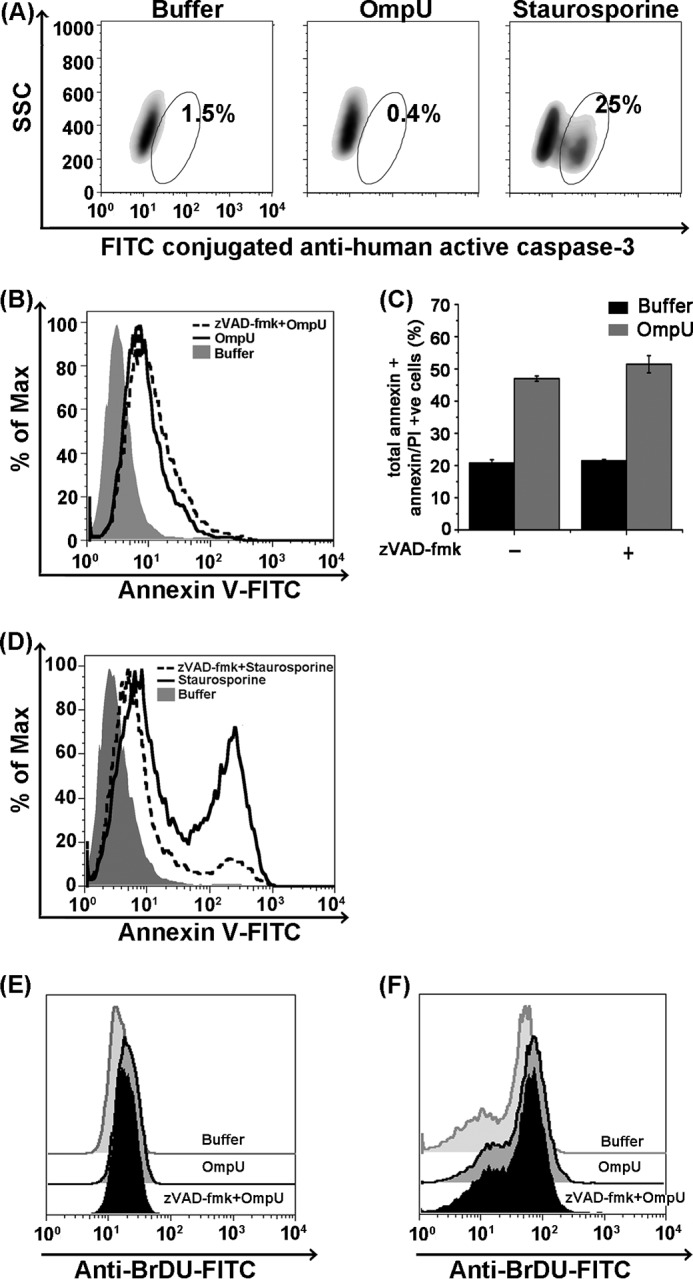
FIGURE 3.

OmpU induces caspase-independent PCD in THP-1 monocytes and HEK 293 cells. A, density plots showing caspase-3 activation in staurosporine-treated cells serving as positive control but no caspase-3 activation in OmpU-treated cells. THP-1 monocytes were treated with 10 μg/ml OmpU or buffer for different time periods or with staurosporine for 4 h. Cells were harvested and stained with FITC-conjugated anti-active caspase-3 antibody. Increased FITC fluorescence (gated population) gives a measure of increased cleavage of pro-caspase-3 to the active caspase-3. Density plots for the 24 h time point serve as representative plots for all of the time points. Two independent experiments for each time point were performed. B, histogram overlay showing no inhibition in OmpU-mediated PS flipping (annexin V-positive cells) upon the use of total caspase inhibitor. THP-1 monocytes were preincubated with or without total caspase inhibitor Z-VAD-fmk followed by incubation with OmpU or buffer. Cells were harvested and stained with annexin V-FITC and PI. As mentioned under “Experimental Procedures,” quadrant gate was applied to all of the tests. Histogram overlay represents the population of cells in the bottom left quadrant plus bottom right quadrant. This is a representative plot of three independent experiments. C, bar graphs showing almost no change in percentage of total annexin V single-positive (bottom right quadrant) plus annexin V/PI double-positive (top right quadrant) cells upon OmpU treatment with/without caspase inhibitor. Quadrant gate was applied to all of the tests. The bar graph shows mean ± S.E. (error bars) for three independent experiments. D, histogram overlay showing a decrease in the percentage of annexin V positive population in Z-VAD-fmk + staurosporine-treated cells as compared with cells treated with staurosporine only. E and F, caspase inhibitor could not block DNA fragmentation induced by OmpU. THP-1 monocytes (E) or HEK 293 cells (F) were pretreated with Z-VAD-fmk, followed by treatment with OmpU or buffer, and incubated for 24 h. Cells were harvested and stained for the TUNEL assay. Offset histogram overlays represent a comparison between Z-VAD-fmk + OmpU-, OmpU only-, and buffer-treated cells in terms of BrdU-FITC fluorescence (DNA fragmentation). Each plot is representative of three independent experiments.
