FIGURE 4.
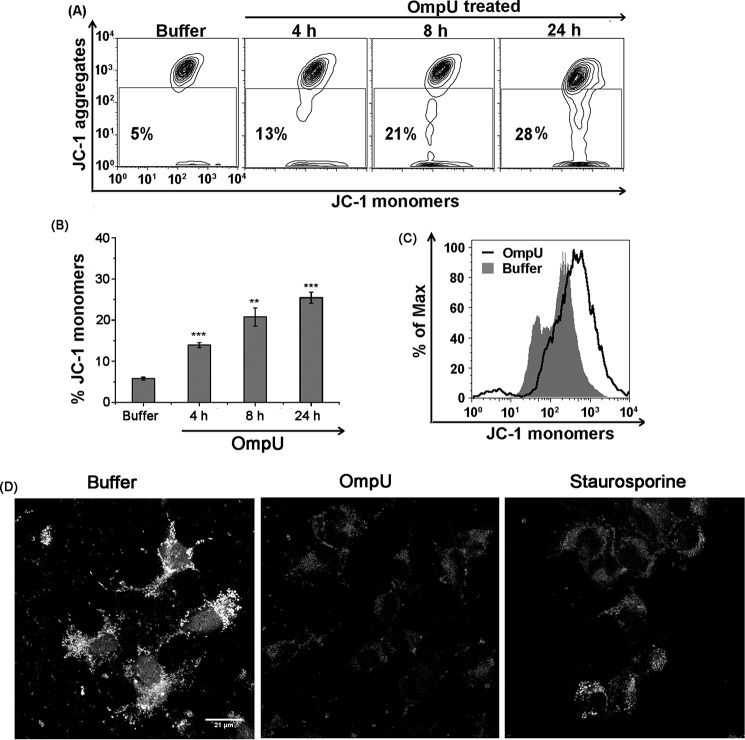
OmpU induces MMPT in target cells. A, contour plots showing an increase in MMPT with increase in time of incubation after OmpU treatment. THP-1 monocytes were treated with 10 μg/ml OmpU or buffer and incubated for 4, 8, and 24 h. Cells were harvested and stained with JC-1 dye for detection of MMPT. Contour plots are representative of three independent experiments. B, bar graphs showing an increase in the percentage of JC-1 monomers in THP-1 cells with increase in time of incubation after OmpU treatment. Shown are the mean ± S.E. (error bars) percentages of cells with increased JC-1 monomers for three independent experiments. *, p < 0.05; **, p < 0.01; ***, p < 0.001 versus buffer control for all of the time points. C, histogram overlay showing more JC-1 monomers in OmpU-treated HEK 293 cells compared with buffer. HEK 293 cells were treated and incubated with 10 μg/ml OmpU or buffer, incubated for 24 h, and stained with JC-1 dye. The plot is representative of three independent experiments. D, microscopic analysis of loss of MMP in target HEK 293 cells. HEK 293 cells were plated and treated with 10 μg/ml OmpU or buffer for 24 h. Cells treated with staurosporine for 4 h were used as a positive control. Cells were stained using MitoTracker Red CMXros and analyzed by confocal microscopy. Images are representative of two independent experiments.

