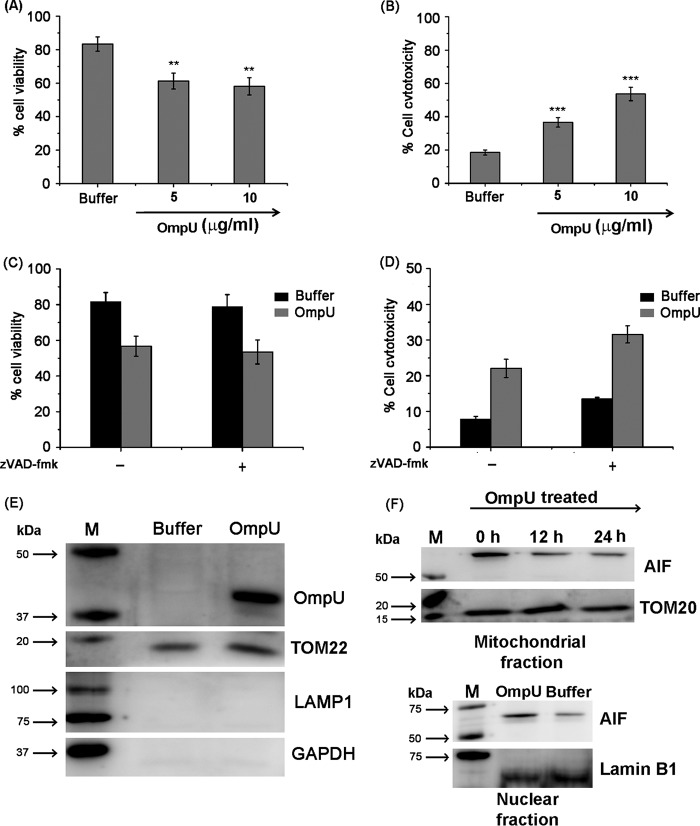
FIGURE 9.
OmpU induces caspase-independent cell death involving OmpU translocation to mitochondria in Caco-2 cells. A, bar graphs showing cell death induced by OmpU in Caco-2 cells measured as loss of cell viability by an MTT assay. Caco-2 cells were plated and treated with OmpU (5 and 10 μg/ml) or buffer for 24 h and subjected to an MTT assay. Bar graphs show the mean ± S.E. percentage of cell viability calculated using values from three independent experiments. *, p < 0.05; **, p < 0.01; ***, p < 0.001 versus buffer control for all of the doses. B, bar graphs showing cell cytotoxicity measured by LDH release induced by OmpU in Caco-2 cells. Caco-2 cells were plated and treated as described for the MTT assay and subjected to an LDH release assay. Bar graphs show the mean ± S.E. (error bars) percentages of cell cytotoxicity calculated using values from three independent experiments. C and D, bar graphs showing that inhibition of apoptosis-related caspases does not inhibit OmpU-mediated cell death. Caco-2 cells were plated and pretreated with 20 μm Z-VAD-fmk, followed by treatment with OmpU (10 μg/ml) or buffer. Cells were subjected to either an MTT assay or an LDH release assay. Bar graphs show the mean ± S.E. percentage of cell viability (C) or percentage of cell cytotoxicity (D) calculated using values from three independent experiments. E, Western blot result showing translocation of OmpU in Caco-2 cells. Caco-2 cells were treated with 10 μg/ml OmpU for 2 h. The mitochondrial fraction was prepared and analyzed for the presence of different markers along with OmpU by Western blotting. F, Western blot result showing the release of AIF from the mitochondria of Caco-2 cells treated with 10 μg/ml OmpU for the indicated times and its translocation to the nucleus. Blots are representative of two independent experiments.

