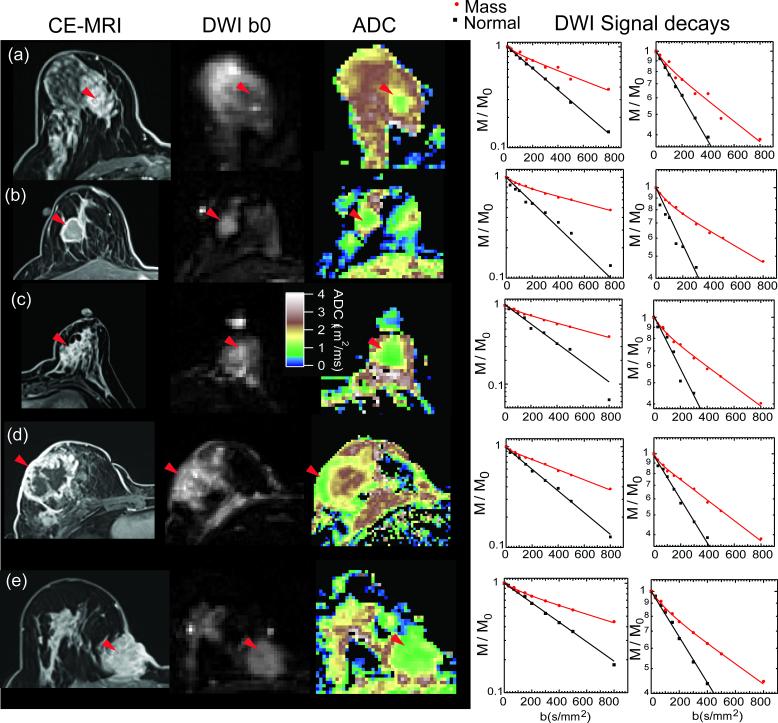
Figure 4.
Example results from several patients in this study. (a) DCIS lesion; (b)-(e) IDC lesions. From left to right: Post-contrast T1 images showing lesion location (red arrowheads); DWI unweighted (b0) images in which lesion is also hyperintense; ADC map showing lower values in lesions than in FG tissue; DWI signal intensity profiles from the lesion area and normal tissue. The enlarged scale view highlights the nonexponential response of the lesion tissue in comparison with the monoexponential behavior of FG tissue.

