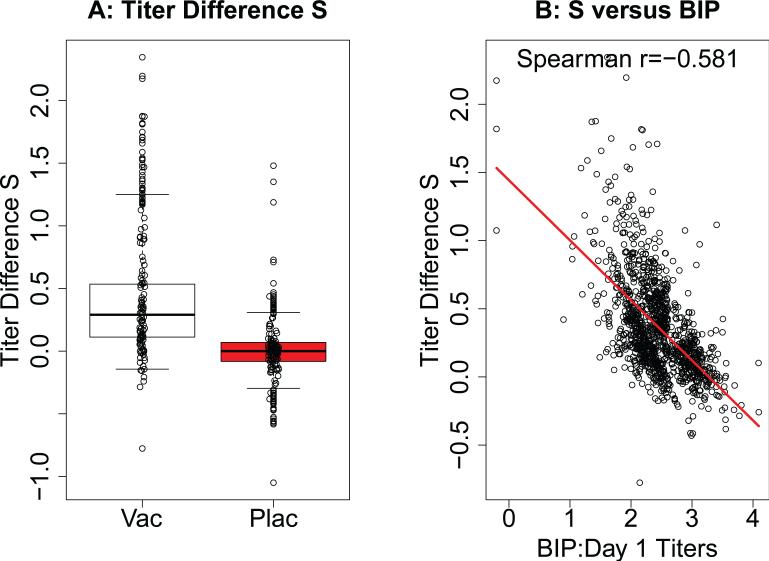
Figure 1.
For vaccine and placebo recipients in the immunological sub-study of ZEST (chosen as a 10% simple random sample, n=1218 vaccine and n=1273 placebo), the (A) boxplots depict the distribution of S|Yτ = 0, the log10 fold-rise of gpELISA antibody titers from baseline (Day 1; pre-immunization) to week 6. Data points are shown for random samples of 100 participants. (B) shows the association between S|Yτ = 0 and baseline gpELISA antibody titers (the BIP) in the vaccine group.

