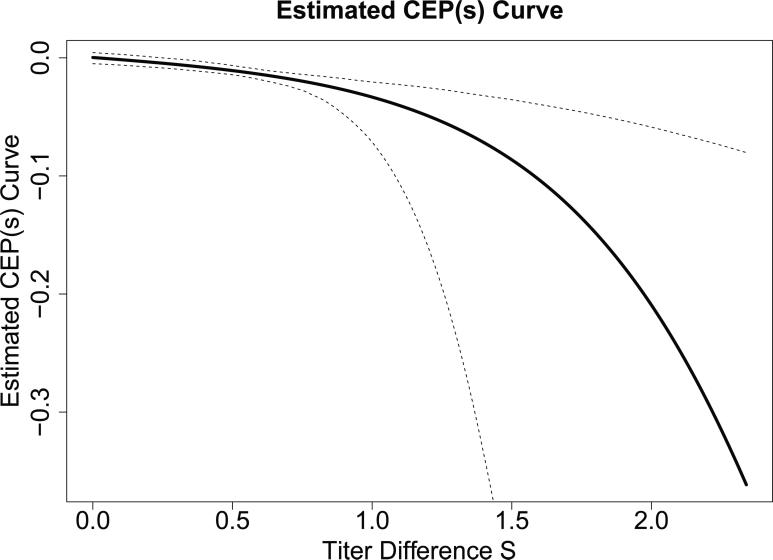
Figure 2.
Point and 95% confidence interval estimates of the CEP curve, CEP(s1) ≡ CEP(s1,0) = risk1(s1,0) – risk0(s1,0), for the ZEST data with candidate surrogate S the log10 fold-rise of gpELISA antibody titers from baseline to week 6. The Weibull estimated maximum likelihood method of Gabriel and Gilbert (2014) was used, assuming a parametric normal model for S(1) conditional on the BIP X and using the clinical endpoint Y = I[T ≤ t] for t = 2 years.

