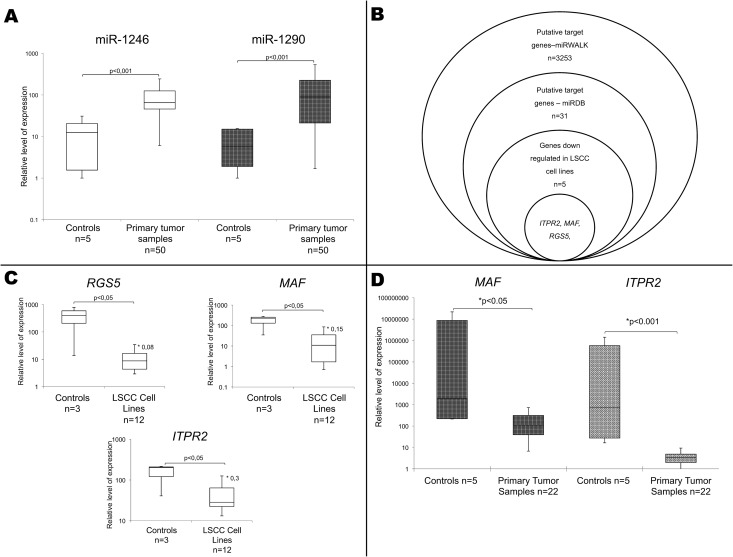
Fig 1. Expression level of selected miRNA and selection scheme of miR-1290 target genes.
A) Overexpression of miR-1290 and miR-1246 in primary LSCC cases (LNA real-time qPCR). B) Schematic presentation of the selection process of miR-1290 candidate genes. C) Expression level of MAF, ITPR2 and RGS5 in LSCC cell lines and no tumor controls (Affymetrix U133 plus 2.0) based on [20]. * fold change in LSCC cell lines compared to no tumor controls. D) Expression level of MAF and ITPR2 in 22 primary tumor samples compared to 5 no tumor controls.

