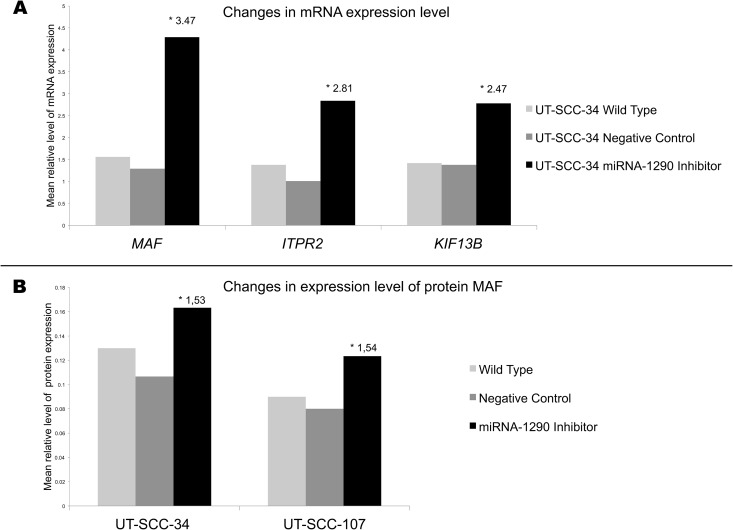
Fig 2. Expression level of miR-1290 target genes.
A) Changes in expression level of MAF, ITPR2 and KIF13B genes in UT-SCC-34 treated by miR-1290 inhibitor (black graph) compared to both UT-SCC-34 treated by negative control (dark gray graph) as well as UT-SCC-34 wild type (gray graph). * fold change in UT-SCC-34 treated by miR-1290 inhibitor compared to UT-SCC-34 treated by negative control. B) Changes in expression level of MAF protein in UT-SCC-34 and UT-SCC-107cell lines treated by miR-1290 inhibitor (black graph) compared to both cells treated by negative control (dark gray graph) as well as wild type cells (gray graph). * fold change in cells treated by miR-1290 inhibitor compared to cells treated by negative control.

