Figure 1.
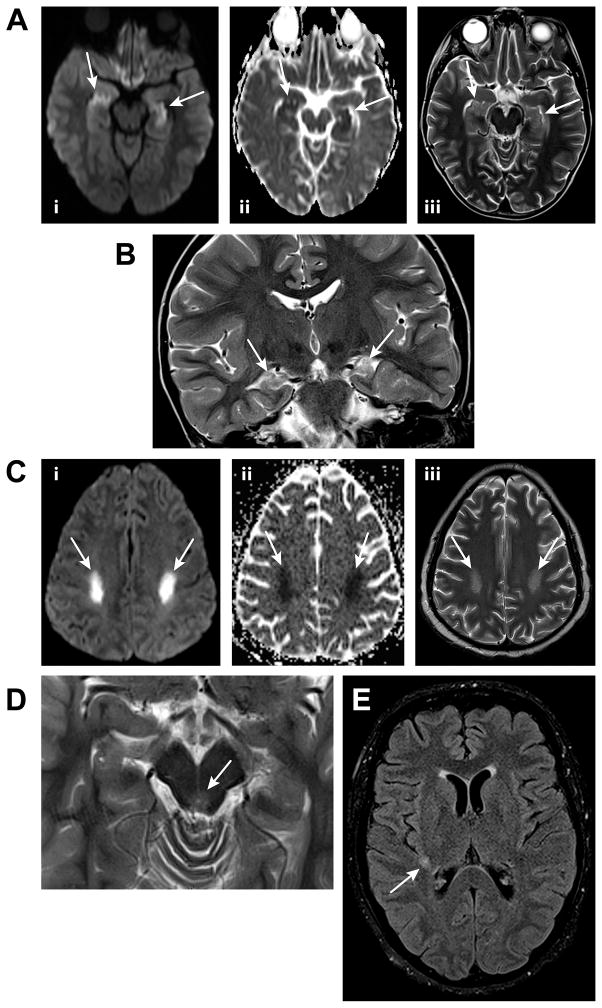
Figure 1A. An axial diffusion-weighted image of the brain for the patient in Case 1 (i) demonstrates high signal in the bilateral hippocampi (arrows) with corresponding low apparent diffusion coefficient values on an apparent diffusion coefficient map (ii), consistent with restricted water diffusion. An axial T2-weighted image (iii) reveals hyperintensity in both hippocampi (arrows). Such findings are associated with human herpesvirus 6 encephalitis.
Figure 1B A coronal T2-weighted image of the brain for the patient in Case 1, obtained approximately 2 years and 3 months after the images in Figure 1A, demonstrates volume loss and hyperintensity in the bilateral hippocampi, consistent with mild atrophy (arrows).
Figure 1C. Axial diffusion-weighted (i) and apparent diffusion coefficient map (ii) images of the brain for the patient in Case 2 demonstrate restricted water diffusion in the posterior portions of the bilateral centrum semiovale (arrows) with corresponding patchy hyperintensity on a T2-weighted image (arrows, iii). These findings are nonspecific but compatible with a toxic myelinopathy.
Figure 1D An axial T2-weighted image of the brain for the patient in Case 3 reveals subtle hyperintensity surrounding the aqueduct of Sylvius. Such hyperintensity may be seen in the setting of Wernicke’s encephalopathy.
Figure 1E An axial T2-weighted fluid attenuated inversion recovery image of the brain for the patient in Case 4 demonstrates a small nonspecific hyperintense focus in the posterior right subinsular region (arrow).

