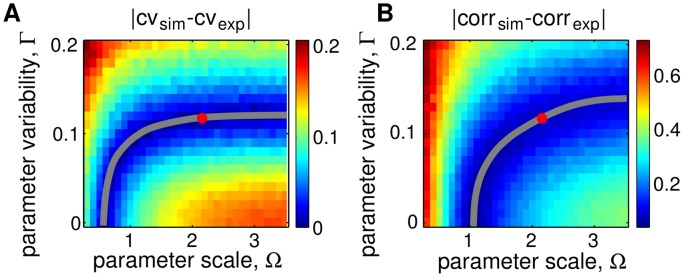
Fig 6. Heatmaps for the differences between amplitude variability and correlation in simulations and experiments as functions of parameter scale and variability.
A. The difference between amplitude variability (gray curve shows contour of the minimum). B. The difference between the correlation function (gray curve shows the contour level that minimizes the difference). The intersection of the curves of minima shown in panels A and B, provides an estimate of the values of Ω and Γ. The two intersect at (Ω0, Γ0) ≈ (2.1, 0.12) (red dot in each panel).

