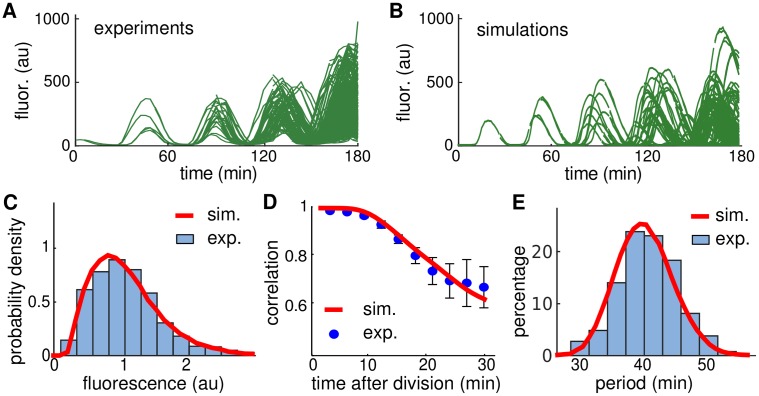
Fig 7. Comparison of experimental and simulated data with 2 mM IPTG.
A. Experimental lineage trajectories obtained from time-lapse microscopy experiments. B. Simulated lineage trajectories of our model using the levels of intrinsic and extrinsic noise estimated in Fig 6 that match the experiments shown in A. C. Distribution of the oscillation amplitudes for experimental data shown in A (blue histograms) and from the simulations shown in B (red curves), with amplitude rescaled by the mean. D. Correlation in fluorescence intensity between sister cells after cell division for experimental data shown in A (blue circles, mean ± s.d.) and the simulations shown in B (red curves). E. Distribution of the period for experimental data shown in A (blue histograms) and from the simulations shown in B (red curves).

