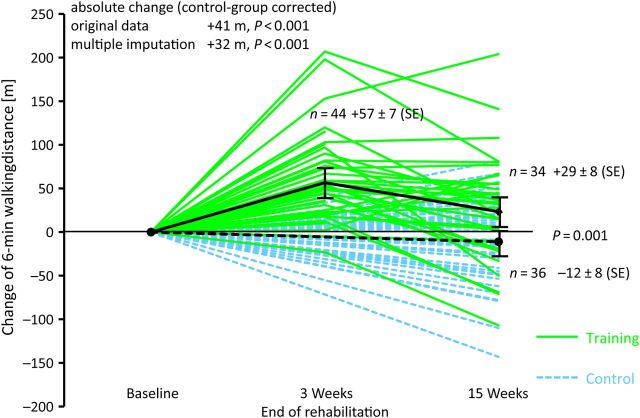
Figure 5.
6MWD. The figure shows the absolute changes in 6MWD for each patient: patients of the training group as solid lines and patients of the control group as dashed lines. Mean changes are given with darker lines, and error bars indicate ±1 standard error of the mean. Exercise training significantly improved 6MWD compared with baseline (P = 0.002). P-values are given for the ANCOVA for original data and multiple imputations.

