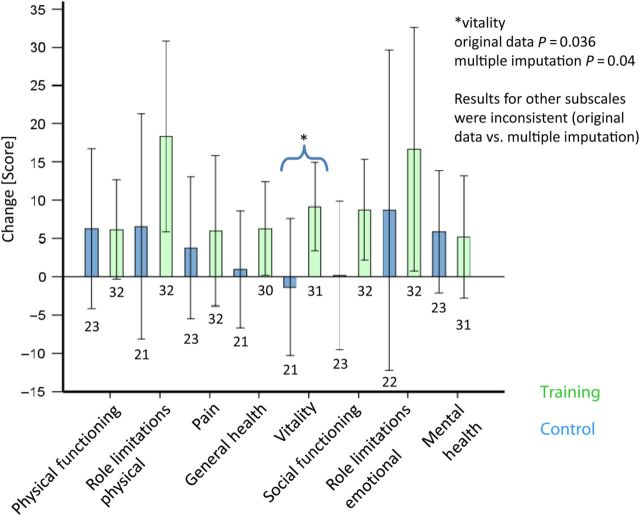
Figure 6.
QoL. Mean changes of QoL ± 2 standard errors of the mean and sample sizes below each bar. The bars of the control group are shown on the left side of each category. Exercise and respiratory training significantly improved the subscale score for vitality (P = 0.036), compared with the control group, in which this parameter slightly worsened. The subscales role limitations due to physical restrictions (P = 0.099), role limitations due to emotional restrictions (P = 0.09), and general health perception (0.091) were significant in trend in the original data, but showed inconsistent findings in multiple imputation.

