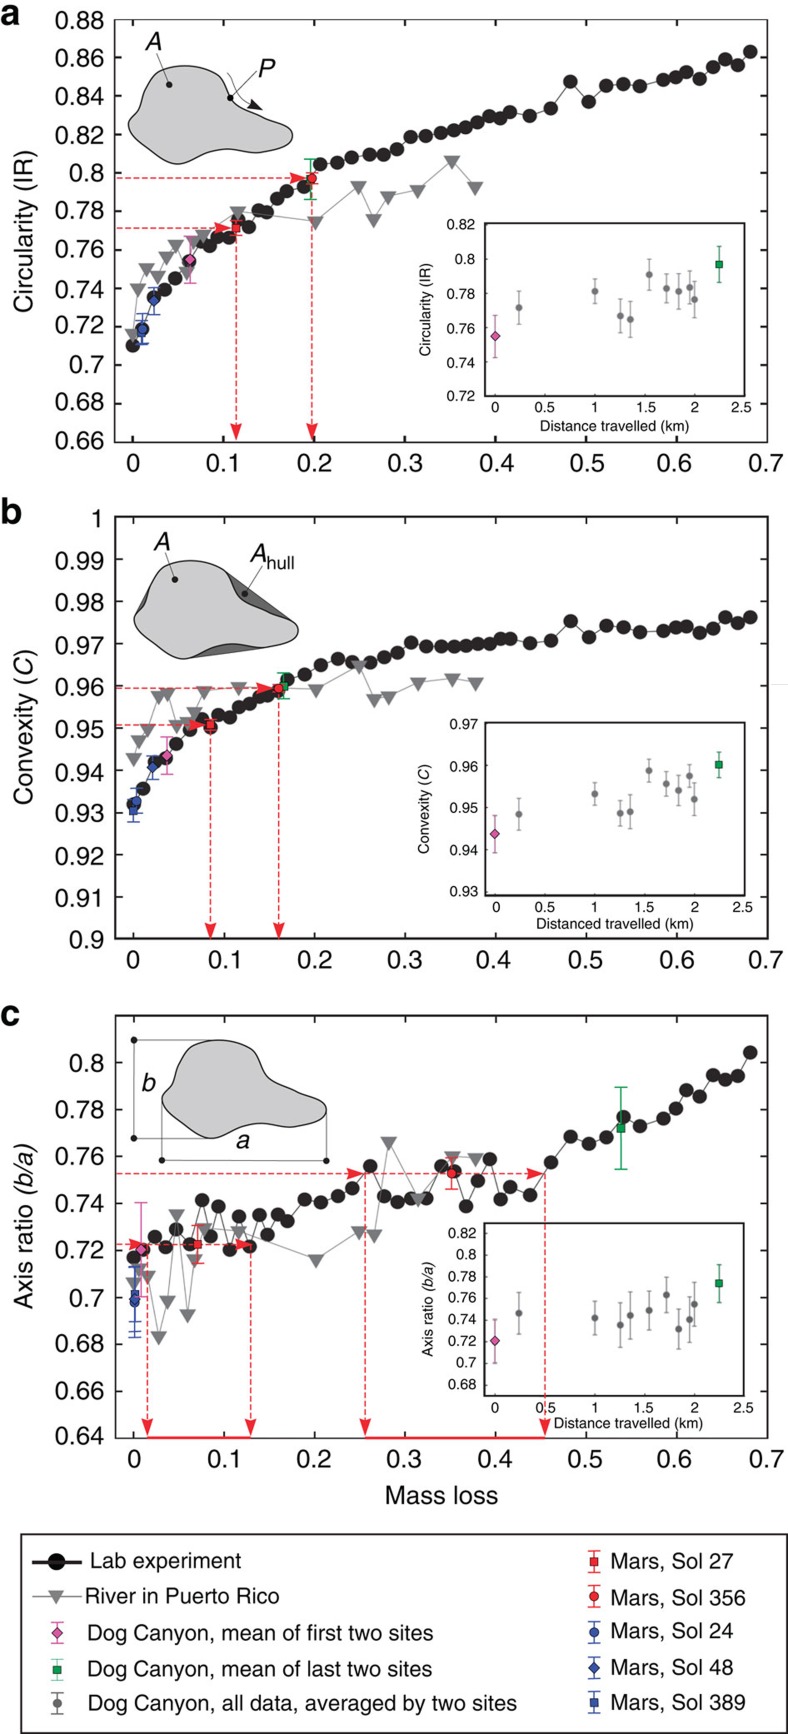
Figure 3. Quantitative shape evolution as a function of mass loss.
Upper left insets: definition of shape parameters. (a) Circularity (or isoperimetric ratio), defined as IR=4πA/P2, where A is the area and P is the perimeter of the pebble's projection in the a−b plane42. (b) Convexity, C=A/Ahull, where Ahull is the area of the convex hull15. (c) Axis ratio, the ratio of the short (b) and long (a) axis lengths. Lower right insets: evolution of shape parameters against transport distance from the apex of Dog Canyon alluvial fan. Neighbouring sites were paired and averaged to form 11 data points from the 22 sites sampled (Methods). Main diagrams show evolution of shape parameters against mass loss in the experiment (black dots), and in the river from Puerto Rico (grey triangles)15. Coloured markers represent mean shape parameter values, with error bars showing the s.e. Rounded Mars pebble values (red markers, Supplementary Table 1) were projected onto the experimental curves (red horizontal arrows) to estimate mass loss (red vertical arrows); the difference in shape values between the two populations is interpreted as inter-site variability rather than a reflection of any trend. Blue markers represent angular clasts from Mars. Dog Canyon results (green and magenta markers) were also projected onto the experimental curves; data suggest particles at fan apex (x=0 km) are slightly abraded due to transport in the upstream canyon (≈5% mass loss), and experience ≈15% mass loss due to bed-load transport over a 2-km distance down the alluvial fan.

