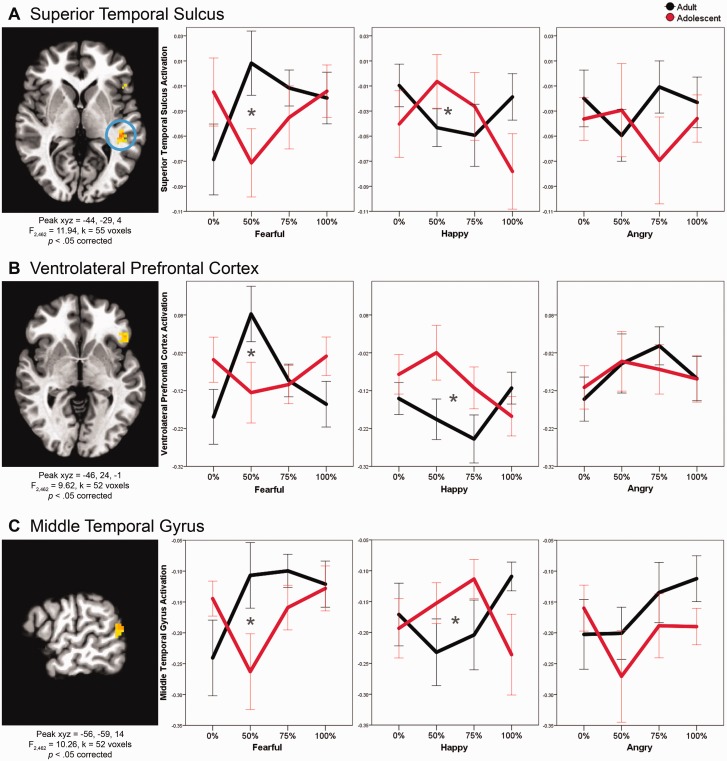
Fig. 3.
Developmental differences in brain mechanisms of facial emotion labeling (Age Group × Emotion × Intensity-Quadratic). For all figures, brain image threshold set at whole-brain corrected false probability rate of P < 0.05. Axial view for (A) and (B), sagittal for (C). In all figures, values were extracted from the clusters and averaged for the plots. Asterisks indicate significantly different quadratic trends between adults and adolescents (P < 0.05 FDR-corrected for multiple comparisons).

