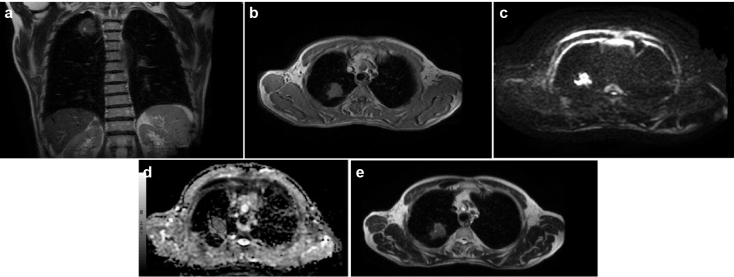
FIG. 2. a–e.
Axial (a) and coronal (b) T2-weighted echo-planar image obtained with a b factor of 0 s/mm2 shows a mass with a slightly lower signal intensity compared with the CSF and a high signal intensity compared with the dorsal muscle; it scored 4 on the 5-point rank scale. CSF scored 5 on the 5-point rank scale on the T2-weighted image obtained with a b factor of 0 s/mm2. The dorsal muscle scored 2 on the 5-point rank scale on T2-weighted images obtained with a b factor of 0 s/mm2.
Axial T1-weighted image shows a mass in the right upper lobe (c), axial diffusion weighted echo-planar image obtained with a b factor of 1000 s/mm2 shows a mass with very high signal intensity compared with the spinal cord (d); it scored 5 on the 5-point rank scale. The spinal cord scored 3 on the 5-point rank scale on DW images obtained with a b factor of 1000 s/mm2, axial apparent diffusion coefficient value of the lesion (1.05×10⁻³) (e), when the b factor was taken as b=1000 mm2/s; this was lower than our cut-off value (1.5×10⁻³).

