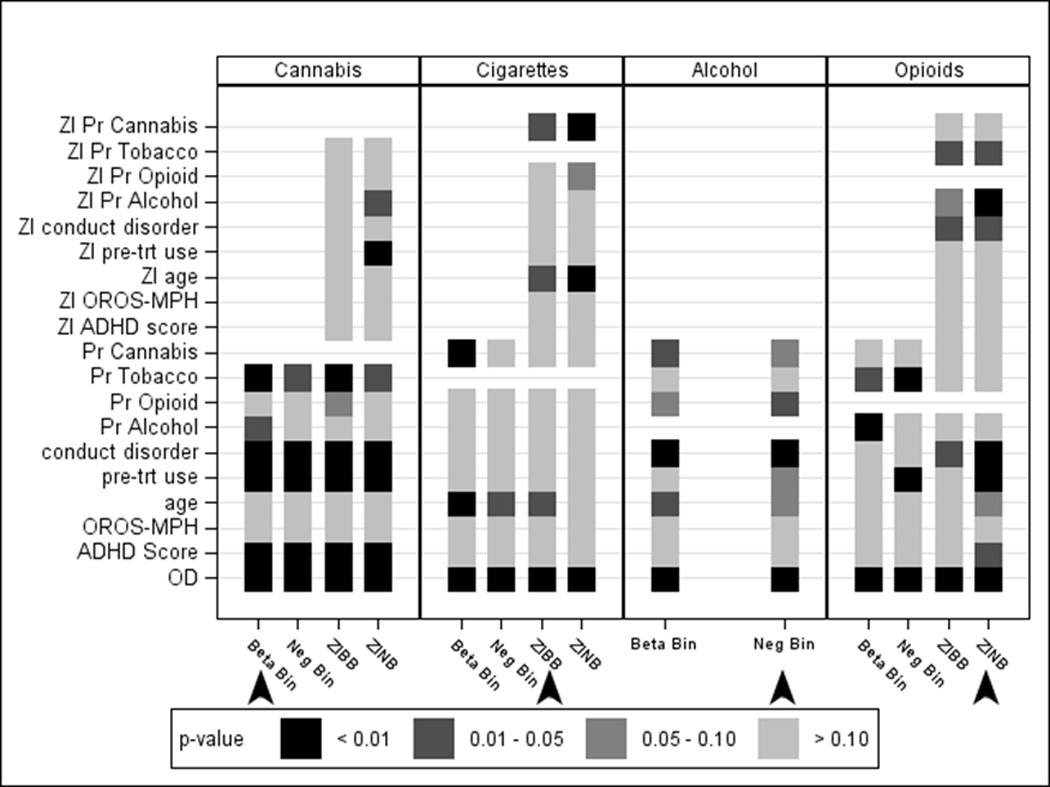
Figure 3.

Significance (p-values) for each variable in each model for proportion of days of cannabis, cigarettes, alcohol and opioid use, illustrating that inferences regarding the predictors of use change depending on the model. Arrows indicate the best-fitting model for each substance. Variables with the ZI prefix correspond to variables included in the zero-inflation probability component of the zero-inflated models predicting non-users; OD = over dispersion parameter; Pr = proportion of days of use.
